1 What he says?
Last modified on 29. October 2026 at 10:30:38
“A quote.” — Dan Meyer
1.1 General background
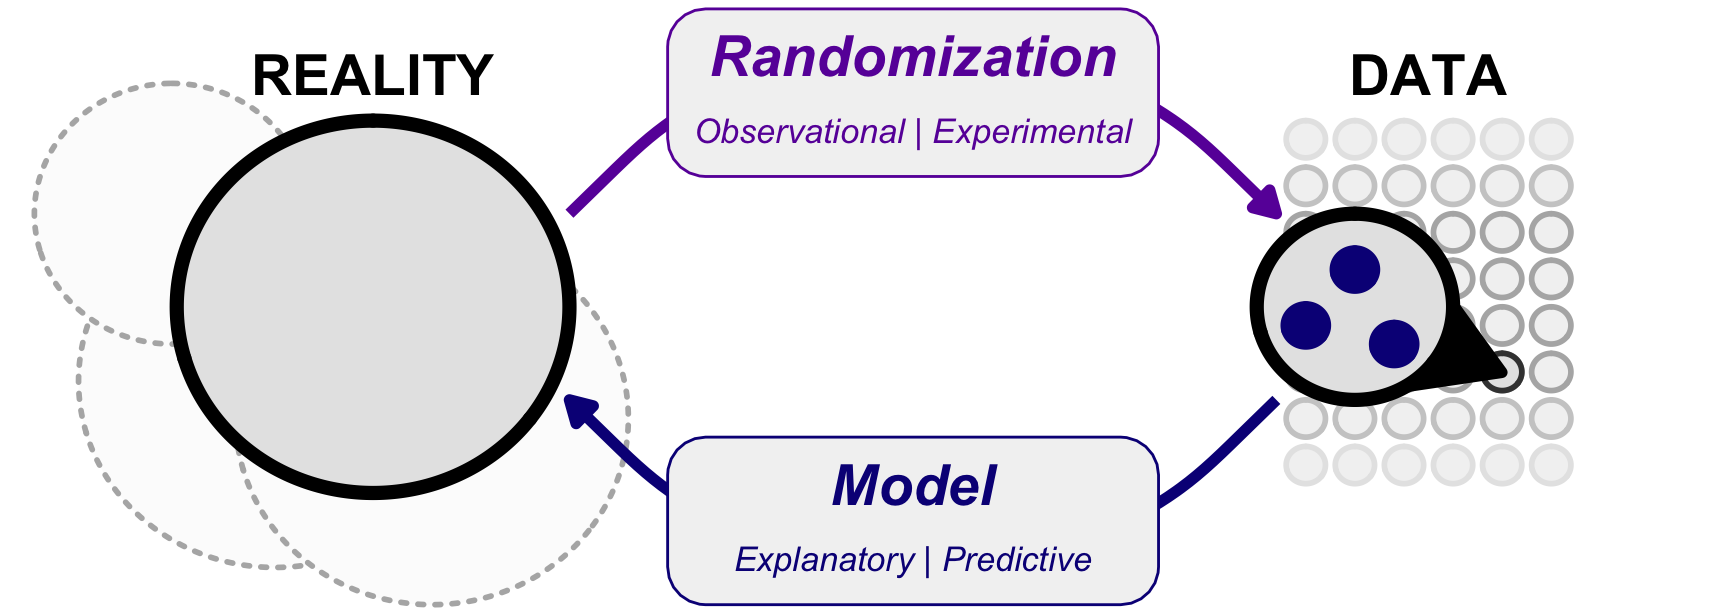
Definition 1.1 (Statistics) In statistics we translate data into probabilities to make model-based decisions.
Definition 1.2 (Probability) A probability describes the frequency of observing an event.
Conditional probabilities are always bound to a given subset.
In statistics the event is not happening.
\[ Pr(\text{your data} \mid \text{no event}) \]
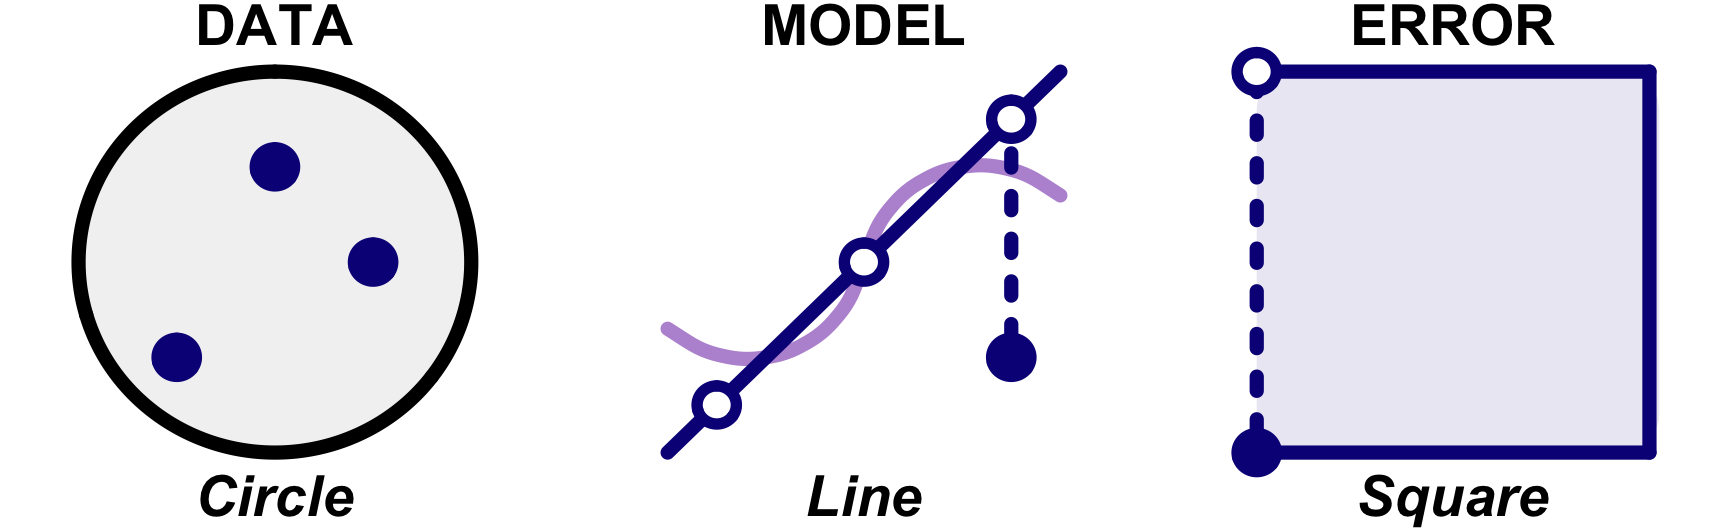
Definition 1.3 (Data) \[ \mbox{Data are} \begin{bmatrix} \mbox{perceptions} \\ \mathbf{information} \\ \mbox{sensations} \end{bmatrix} \mbox{cast into numbers.} \] Although data only represents a fraction of reality, it is possible to draw conclusions about reality itself.
See Definition 1.3.
1.2 Theoretical background
1.3 R packages used
1.4 Data
1.5 Alternatives
Further tutorials and R packages on XXX
1.6 Glossary
- term
-
what does it mean.
1.7 The meaning of “Models of Reality” in this chapter.
- itemize with max. 5-6 words