1 What is science?
CautionOpen issues
- Cross references to the other chapters
- Cleaning of the broken ideas section after rereading
Samuel und Thompson (2021)1 Lakoff and Johnson (2008)2
Last modified on 09. July 2026 at 11:36:16
“This is your last chance. After this, there is no turning back. You take the blue pill - the story ends, you wake up in your bed and believe whatever you want to believe. You take the red pill - you stay in Wonderland and I show you how deep the rabbit hole goes.” — Morpheus, Matrix
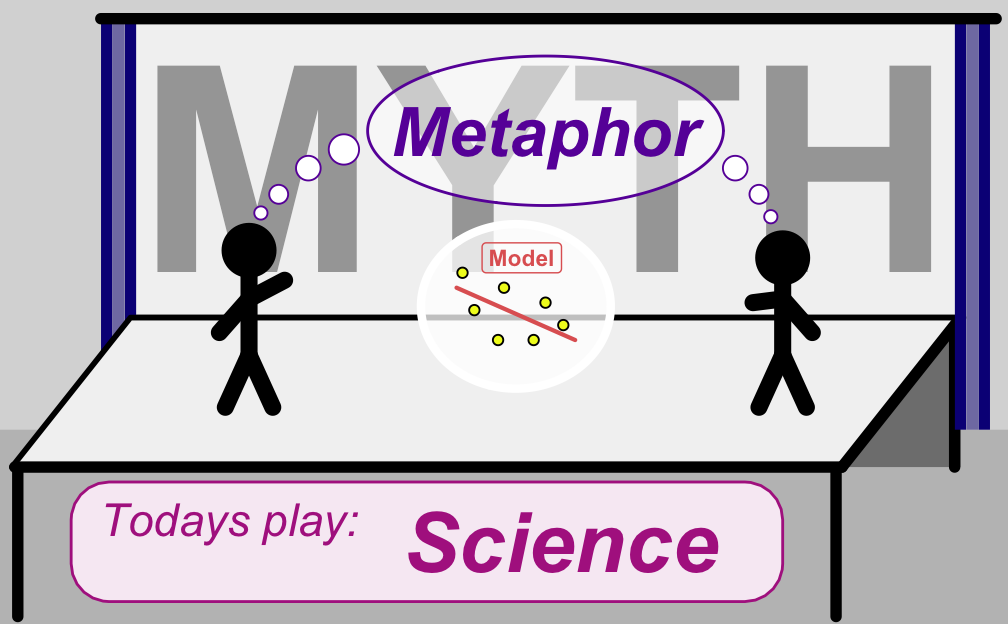
The stage. The stage was where everything was happening. Emma had been an actor for as long as she could remember. Still, the mechanics of the stage or even its purpose never crossed her mind. Something was rotten beneath her feet, though. She could feel Jeff’s eyes on her. He was sitting somewhere in the dark, waiting for her to start. However, she could not start playing until she understood the stage. The structure. The why. Emma started looking around in the darkness, using each flickering light to gather information about her surroundings.
“Jeff, how old is this stage where I’m supposed to play?” She asked, walking and looking around.
“Hundreds of years, I suppose. Why is it important to you? You’ve been playing the game for years, and I think you will continue to do so for many more years. The stage doesn’t matter if you do a good job. Just perform the play. What does it matter how the stage is build, the light works, or where the music comes from?” Jeff answered sharply, only moving slightly in his red chair.
“Sometimes I don’t like you, Jeff.”
“How can you dislike someone you can’t even observe?”
Emma ignored Jeff for a moment and mumbled, “Something has changed. Something is different. By understanding the stage, I will become a better actor. My work will be more influential and richer.” Emma starts to look behind the stage curtains.
Jeff grumbles. “You won’t like what you see…” But Emma had gone too far.
“Anything goes” is Paul Feyerabend’s famous dictum5. Therefore, you can stop here. If you are not interested in the historical or philosophical background of what we call science, then skip ahead to the next chapter. You don’t really need the background. Or, to say it in the words of David Mermin, “Shut up and calculate!”6 With this statement, Mermin describes the Copenhagen interpretation as a philosophy of quantum physics that prioritizes mathematical results over foundational philosophical questions. Even if you don’t have a theoretical background, you can work on knowledge generation and new devices. Therefore, if your time is limited, go on, brave seeker after truth.
For everyone else, I have written this introduction chapter. Maybe you’re puzzled about what this science thing is all about. That’s perfectly normal. Today, education strips away the historical and philosophical context and jumps directly into biological, chemical, or physical topics. History tells the story of countries and people, not the combination of history and the natural sciences. There is so much to learn. Therefore, there is seldom room for philosophy in any rushed school schedule. However, humans do science. What humans do becomes history. The reasons and ways in which humans do things are strongly connected to their thoughts and beliefs. Therefore, they have a philosophy, even if they are not aware of it. So, if you do science, you do so with a particular way of thinking. Perhaps science is, at its core, something personal. However, science also has objective aspects that I want to present here. Therefore, you have a philosophy, whether you are aware of it or not. It’s time to talk about it a little bit. Ultimately, decide for yourself what science truly is.
1.1 Philosophies of science
What could possibly be a better argument for something than the thought of a genius and Nobel Prize winner? Therefore, we begin this section with a quote from Albert Einstein.
“I fully agree with you about the significance and educational value of as well as history and philosophy of science. So many people today - and even professional - seem to me like someone who has seen thousands of trees but has never seen a forest. A knowledge of the historic and philosophical background gives that kind of independence from prejudices of his generation from which most scientists are suffering. This independence created by philosophical insight is - in my opinion - the mark of distinction between a mere craftsman or specialist and a real seeker after truth.” — Albert Einstein
Don’t worry, we won’t start with the science of the Stone Age. Instead, we will focus on the modern era and the knowledge gathered during this time. In this section, we will also focus on science itself. We will discuss data and models later. For now, we will focus solely on the meaning of science. Science is hard to pinpoint. I thought it would be easy to define. What could be the problem? Then I thought about it, read about it, and thought about it again. There are three big books. The fact that there are four big books alone shows you that it cannot be so easy to define science. Yes, it is complicated. In the end, I will give you all the sources, but for now, there are four books: The Logic of Scientific Discovery by Karl Popper7, The Structure of Scientific Revolutions by Thomas S. Kuhn8, The beginning of infinity: Explanations that transform the world by David Deutsch9 and Against Method: Outline of an Anarchistic Theory of Knowledge by Paul Karl Feyerabend5. You can read these books or not. I will give you a brief introduction and refer to them. As always, a brief summary cannot encompass all the ideas of these books.
Before we continue, I would like to present a brief example of knowledge generation. How can we obtain enterprise knowledge? We will explore the appealing ideas and concepts from the beginning of the last century. In our case, we will explore cholera as a human curse through the lens of a renowned German scientist and his theories. In science, everything starts with an observation. As Isaac Asimov said, “In science, everything new begins with someone muttering: ‘Hmm, that’s strange!’”
NoteCholera and breathing walls
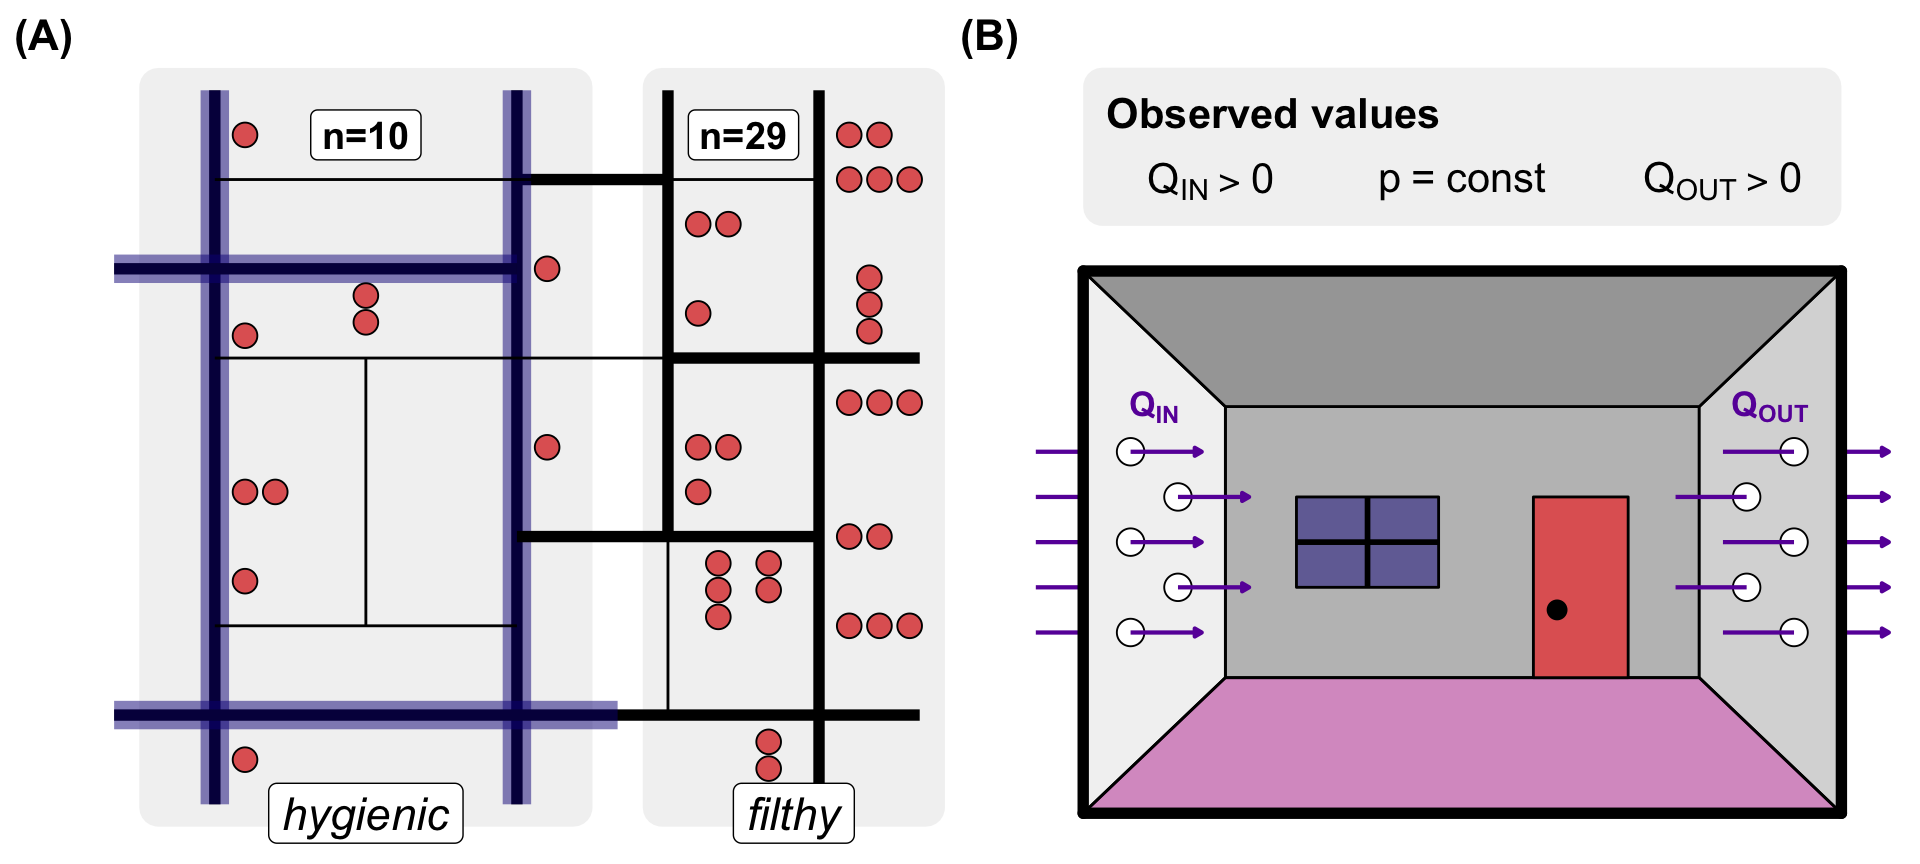
In 1854, cholera visited the city of Munich in Bavaria, Germany. This was not a pleasant visit, as many citizens died of cholera and its consequences. However, not all parts of the city were affected equally. By the end of the 19th century, Munich would become one of the cleanest cities in Europe. Max von Pettenkofer achieved this by building and renovating the canalization system. When cholera arrived, not all parts of the city had equal access to the canalization and fresh water supply. Some parts of the city had easy access to fresh water and working toilets. In other parts of the city, sometimes only divided by a street, construction of the canalization had not yet begun. It was observed that the death toll from cholera varied by district.
In the following Figure 1.2 (A) we see a fictional pattern. It is of two districts of Munich. On the left, the sewerage and freshwater systems are already installed and operational. We can call this area the “hygienic area.” On the right, the canalization has not been finished or even started. We will call this area “filthy” or “dirty.” After the cholera epidemic outbreak, the number of deaths in each district was counted. There were ten deaths in the hygienic area and twenty-nine in the filthy area. We assume that both areas have roughly the same number of inhabitants.
Pettenkofer observed the lower death rates in hygienic areas and concluded that canals and fresh water would stop cholera from spreading and killing people. Therefore, more sewage systems must be installed, and the city must be cleaned up. But wait a minute. What is the cause of the deaths? Yes, it is the illness cholera. But how does it work? What causes the illness? Pettenkofer discovered a way to cure or prevent cholera, even though he did not understand the cause of the illness. He did not know how it was transmitted or why people died from it. He proposed that the cause should be found in specific soil and groundwater processes.
In 1883, Robert Koch discovered the cholera bacillus to be the cause of the illness. Pettenkofer did not believe in unobservable bacteria. In 1892, at a cholera conference, his belief was so strong that he drank a cholera culture. He survived with mild symptoms. According to Pettenkofer, the cholera culture could not be the reason people died. He was still alive.
Another example of Pettenkofer’s thinking is the breathing wall. Figure 1.2 (B) shows the experimental setup. Pettenkofer sealed off his office. He sealed the doors and windows with glue. From his point of view, the room was perfectly contained. Then, he measured the airflow inside the room. The room’s pressure stayed constant while an influx could be measured. Therefore, Pettenkofer concluded that air could pass through the walls’ pores. Thus, the breathing wall model was born. However, it has been suggested that Pettenkofer might have forgotten to seal a chimney, or that the wooden floor and ceiling might have been leaking.
That’s where we come to a halt. What is Pettenkofer doing? He was a very successful scientist. But he was sometimes wrong. Interestingly, Pettenkofer came up with one of the precursors to the periodic table of elements. He had to stop his work due to a lack of funding from the Bavarian state. In 1869, however, Dmitri Mendeleev, the discoverer of the periodic system, mentioned Pettenkofer in his articles as one of the few who influenced his work. Pettenkofer only looked at what he could see. His thought process was bound to the observable and the instruments he uses.
Now, we will learn about the philosophy of science. We will use Pettenkofer as an example. We will meet other people with strange ideas later on. Strange ideas are also science. It’s thinking outside the box. From a philosophical point of view, who was Pettenkofer? He was a positivist. This is a specific philosophical approach to acquiring knowledge. Positivists only believe in what can be seen or observed. If you wear glasses, you may notice a slight flaw in the argument about what is and isn’t observable while reading this book.
Before explaining different philosophies in science, we will take a brief detour into logical reasoning. Logic is necessary from time to time, so we will first cover the basics of inductive and deductive reasoning.
1.1.1 Two paths of logic
Logic is a tool for finding truth. The word “logic” originated from the Greek word logos, meaning “word,” “reason,” or “discourse.” Therefore, logic is essentially the art of making sense. But be careful. Logic is merely a tool and is not the ultimate determiner of truth. Logic is built up in chains of statements. There are two ways to form logical chains: One is from the bottom up, and the other is from the top down. We call the bottom-up approach inductive reasoning and the top-down approach deductive reasoning.
The following Figure 1.3 illustrates both logical pathways. On the left is inductive reasoning. We start with an observation, or data, and try to find a pattern in it. These patterns are called laws or models. These patterns can be thought of as mathematical formulas or statements that describe the patterns in the observations. From these patterns, we try to find an overarching theme. This theme is our conclusion or theory. Therefore, we start with specific numbers and spreadsheets and try to derive general rules from them. This is how you do inductive reasoning.
On the right, we find deductive reasoning. First, we have a general theory, and then we deduce an experiment from it. In other words, we have a theory and then imagine an experiment to test it. This experiment can be a thought experiment or a physical experiment as large as a particle collider. Based on the results of the experiment, we can then draw conclusions about our theory. Therefore, we can see deductive reasoning as a top-down approach. We start with a general theory and draw more specific conclusions from experiments.

Logic is a tool, not a science. This is important for this chapter. We can create any logical chain, but that does not mean the chain contains truth or describes reality. Often, we do not know which reasoning we are applying, but it is usually inductive reasoning. In statistical modeling, we often use inductive reasoning. We start with data and try to find patterns in our observations. Conversely, pure deductive reasoning starts with an assumed truth and moves toward a conclusion. Sometimes, in science, the starting point is pure creative guesswork. Therefore, some scientific approaches use parts of deductive reasoning, but they do not start with a truth; rather, they start with a guess.
Now, let’s take a closer look at knowledge generation concepts. There are many different ideas out there. Some are outdated, some have had a huge impact, and some have lived on in other philosophies. Most scientists don’t have a philosophy at hand, but they do science. Philosophy is often not taught in schools, so everyone is doing something as long as it works. Therefore, I tried to provide an overview of the most important philosophies that you might follow in part or that might have an impact on this book.
1.1.2 Scientific philosophies
We will discuss statistical modeling later in this book. Statistical modeling does not come from nowhere; it includes parts of knowledge generation. However, it is susceptible to other philosophies and can be used in different ways. We want to explore these philosophies because they occasionally touch topics related to statistics. Statistics are founded in a historical context, so we will take a closer look at that. In statistics, it is common to observe things and then generate data. Statistics can also be seen as data analysis. Therefore, we start with the observable.
How does the human mind learn? How do we gather information? Humans are born in a blank state. No ideas are implanted in the brain; only instincts guide the infant through the first weeks and months. Shortly after, the infant begins to learn through the senses. This is mostly true and forms the basis of empiricism. I will not focus on human development. Therefore, we will only focus on the origin of empiricism as a basis for generating knowledge. The idea of empiricism is simple and appealing. In my experience, common sense often begins with empiricism to gather knowledge. Therefore, we will start with this simple idea and explain its history.
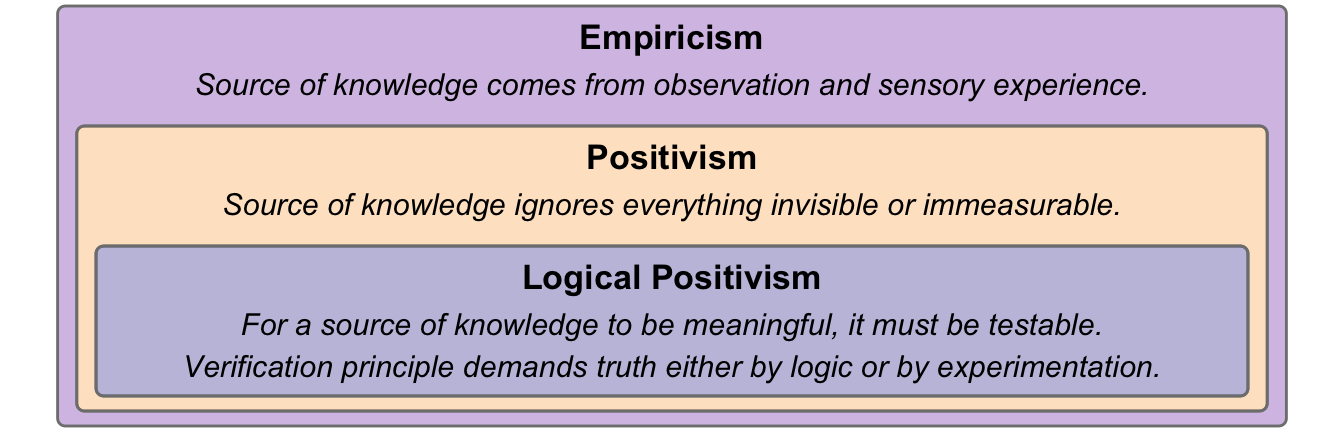
We conclude that empiricism is the source of knowledge, and that observation and sensory experience provide that source. We learn through our five senses, which shape our ideas. The focus is on the human mind.
Next, we will broaden the scope of empiricism by asking how science and society should function. Since we have learned through our senses, we can apply this idea to science and society in general. Since we will focus only on observable things and dismiss invisible entities, we will call our concept positivism. Positivism comes from the Latin word positum, meaning “that which is given” or “laid down.” No, this does not make it any better. Positivism was founded by Auguste Comte (1798-1857) in the early nineteenth century. Comte also favored the idea of the verifiability criterion of meaning. According to this criterion, a statement must be empirically verifiable. We will meet this criterion again soon. Furthermore, we must distinguish between two completely different concepts that often pop up in our minds. Positivism is often confused with positive thinking. This is a common linguistic mistake, but positivism and positive thinking are not related. One is a rigorous philosophy of science, while the other is a psychological mindset or self-help technique.
In positivism, we can say that the validity of knowledge comes from observation and sensory experience, but it ignores everything invisible or immeasurable. In other words, if you cannot measure or observe something, it shouldn’t be part of a serious discussion.
Now, let’s turn the wheel of positivism a bit further towards the extreme. Therefore, we must visit Vienna in the early 19th century. The Vienna Circle was a group of philosophers who met at the University of Vienna from 1924 to 1936. They had a big influence on the study of philosophy and science. In 1929, the Vienna Circle wrote “The Scientific Conception of the World”, also known as “The Manifesto.” The manifesto had two aims. First, it introduces the group and Vienna. At the beginning of the text, it reads more like an advertisement for Vienna and the Vienna Circle. More scientists should join the club. The philosophical main points are somewhat buried in the text. The Vienna Circle proposed that science is both empirical and positivist; knowledge comes only from experience. Furthermore, the process of scientific world conception involves applying logical analysis to observed objects, or, in other words, experience. A statement can only be meaningful if it is testable. This is called the verification principle.
In logical positivism, we conclude that knowledge is valid when acquired through sensory experience by integrating modern methods of mathematics and logic. For a statement to be meaningful, it must be testable through observation. It must either be proven true by logic (an analytic statement) or by experimentation (a synthetic statement). Thus, the verification principle is introduced.
Positivism has a strong influence on the social structures of science and, consequently, on individual scientists. One such scientist was Ernst Mach (1838-1916). Mach greatly impacted the philosophy of knowledge generation with his Machian physics. Machian physics rejects Newtonian theories of space and time, supporting a relative approach to motion instead. Mach’s work inspired Albert Einstein in his search for the theory of general relativity. Machian physics is based entirely on directly observable phenomena. During his lifetime, Mach rejected the existence of atoms. Ultimately, Einstein rejected the positivist aspect of Machian physics, yet many scientists still considered him a positivist. The thinking goes that, since he supported Mach, he also supported the philosophy behind it. Science is always done in a social context.
The following figure summaries the three concepts, from empiricism to logical positivism. There is significant overlap between these concepts. However, the concepts become stricter and focus more on science emerging from the individual human in empiricism. We remember that truth comes from observable things and that statements must be verified by tests.
Why does it matter? From a casual point of view, most parts of positivism makes perfect sense. We see something, come up with an explanation, and test if the explanation is true. This is a very casual concept in science. We are seeker after truth. Later in this book, we will focus on experiments and observations from experiments. These observations are called data. We don’t always need an experiment to gather data; we can also observe nature and draw inferences from it.
In our daily scientific work, we produce data that consists of observations. Therefore, we are drawn to the logical positivism approach. It makes sense to believe only in what we can see and disregard everything else.
However, there is a problem. Or to write it in the words of John Passmore, who said: “Logical positivism is dead—or as dead as a philosophical movement can be.” If logical positivism is no longer working, then it never was. Then, we will need a different philosophy on which to base our science. As scientific workers, we could also adopt another philosophy. Statistics is a basket of flowers full of algorithms and models. We can choose from many of them and apply them to data. In this case, the focus is on the algorithm or model. If we only care about them, we follow a different philosophy. Instead of focusing on the observable, we focus on the algorithm that works best as a tool or instrument.
“Shut up and calculate!”6, it is more or less its origin in the philosophy of instrumentalism. The idea of instrumentalism is not far from logical positivism. Positivism is based on the observable. We only believe in knowledge gathered from visible things. Therefore, we focus on the what. Instrumentalism also looks at things and tries to describe them. Pierre Duhem (1861-1916) first developed the idea of instrumentalism. This philosophy uses mathematical models or logic to predict and explain nature. However, it doesn’t matter if the mathematics describe some type of truth. As long as the mathematics or models work, everything is fine. If there is a deviation, the math can be adapted through knowledge generation. Instrumentalism only focuses on the how and does not ask if there is a theoretical background behind a model as long as the model works. Maybe particles exist or maybe they don’t. Everything is merely a means to make predictions. Even if the model fails, it is only a technical hiccup that must be repaired. A scientific theory is merely a tool that humans use to predict observations in a particular domain of nature by formulating rules. Therefore, instrumentalism is also a prominent form of anti-realism in science. We have useful models that produce successful predictions. We do not need to know whether something like atoms or genes actually exists. A theory can work perfectly well even if it is false. Something is true because it works. In anti-realism, we also focus on what we can measure and use to make predictions. The existence of the moon is irrelevant if there is no one to witness it.
In instrumentalism, we conclude that a theory of knowledge should be useful. We use rules as instruments and tools to predict observations. The statements do not need to describe reality or unobservables as long as the rules produce stable success. It’s not worth asking what would happen if nobody was watching.
As a statistical worker, the danger of instrumentalism is believing in our models too much. It is to love the process of testing and evaluating models and benchmarks. We find the functional tools, but it doesn’t matter if these tools are based in reality. Statistical models should be useful and work.
In 1943, Ayn Rand (1905-1982) introduced objectivism as a philosophy of strong realism and a rejection of mysticism, and all forms of religion. At the heart of her philosophy is the heroic human, capable of anything through the power of the mind. At its core, objectivism is optimistic and guided by reason. Rand chose the name because objectivism is bound to reality. Objects exist independently of consciousness, and knowledge can be attained through inductive logic. Therefore, whether or not something can be measured or observed is irrelevant. The philosophy has a drawback in that it uses a verification principle derived from induction. Therefore, we observe and discover the truth. This is not ideal by any means. Finally, objectivism puts humans at the center, and humans are able to understand reality through reason. As a non-academic, Rand’s philosophy lived a niche existence.
Do you remember Pettenkofer and his fight against cholera? He focused on observable factors, such as who died and who stayed healthy, and discovered the importance of sanitation. He used the sewage and freshwater systems to cure cholera. Or maybe to just prevent it? Science works. Where is the problem?
At this point, we can finally reference a famous saying in statistics: Georg Box said, “All models are wrong, but some are useful.” I don’t know why, but the saying always annoyed me in a subtle way. Now that I understand the connection between instrumentalism and anti-realism, I know why I dislike them. From my perspective, there is a reality, even if no one is watching. Therefore, not all models can be wrong. The moon exists, and it follows a trajectory described by a formula, or more generally, by a statement or law. The movement does not stop and the moon does not vanish if no one is watching. Therefore, there is a true model of the moon’s movement. This brings us to the final philosophy I would like to introduce. I will address all its problems in the context of statistical modeling for the rest of the book.
Now we will learn the philosophy of critical realism or critical rationalism. Sometimes, the lines between different philosophies become blurred. Here, we need the core principles of the philosophies, not their minor differences. Critical realism asks: “What must the world be like for science to be possible?” For science to be possible, the world cannot be a collection of random events. Reality must be understandable, orderly, and accessible to the human mind through observation and reason. Science depends on a realistic worldview. We believe that the world is real, not just a dream, but a structured place waiting to be understood. If the world were a chaotic jumble of “useful models,” as instrumentalism suggests, or a series of perceptions, as positivism claims, science would not function as well as it does. We can conduct experiments in a laboratory and apply them to a star millions of miles away. This suggests that there are objective, universal mechanisms at work.
In his 1959 book The Logic of Scientific Discovery7, Karl Popper introduced one big idea: The falsification principle states that statements should be falsifiable. Falsifiability was introduced. We will call it falsification in this book. The idea behind the falsification principle is simple. You cannot prove any theory by induction. This is because induction is based on observations. It is impossible to observe all possible instances. A classic example is the idea that all swans are white. It is impossible to observe all swans, so you can never be sure that all swans are truly white. However, if you observe one black swan, you can reject your statement. Again, there is a drawback here. All of our statements or hypotheses must be testable and falsifiable. If our statement cannot be tested, or if no experiment can produce a false result, we cannot make a decision about our statement. Ultimately, falsification means there is no truth in science. Knowledge is not verified. Knowledge grows by proving us wrong, not right. This is an unpleasant idea in common sense. As scientists, we actively try to disprove our theories, searching for the weak points that will break them. In doing so, we hope to find a better explanation or theory.
There is one major problem with Popper’s idea of falsification. We could end up with no theory at all. If we reject a hypothesis, statement, or even a whole theory, nothing is left. In his book The beginning of infinity: Explanations that transform the world9, David Deutsch extends Popper’s ideas. Deutsch introduced the good explanation. Science is not only about making predictions, but also about explaining reality. Therefore, reality exists and can be described. A good explanation is “hard-to-vary.” We cannot easily change parts of a theory to fit a particular story which came into our mind. If you can’t imagine an experiment that could prove your theory wrong, then you’re not doing science, you’re telling stories. Consequently, good explanations are easy to falsify. A hard-to-vary explanation makes specific predictions. These predictions are easy to test. Therefore, we use the process of falsification to test our explanations and theories. Unlike Popper, we do not discard a theory that has been partially falsified unless we have a better explanation. We conserve our theories if we do not have a better one. We also want to know why a theory is false. Understanding this is important for developing better theories. In addition, good explanations have a wide reach. We can use them for different objects and implementations. The explanation of Newtonian gravity, for example, has a wide reach. It allows us to calculate the orbits of planets, predict comets, and build bridges. Each scientist’s goal should be to find explanations with a wide reach. For Popper and Deutsch, the falsification principle is the demarcation line of science. With this principle, we can distinguish between science and non-science.
Deutsch suggests a deductive scientific approach. We should make a bold guess about how reality works. This is the creative aspect of the human mind. Humans are universal explainers, capable of solving any problem with the right knowledge. The guess should be an explanation that is difficult to vary. Then, we design experiments to test the theory under all circumstances. In doing so, we will falsify parts or all of it and learn new things. We will find an intermediate truth as a new starting point for further guessing.
Why does Deutsch prefer deductive reasoning over inductive reasoning? First, there is no logical link between something happening before and it happening again. Just because something happened and was observed does not mean that the observation will always occur in the future. Past patterns of observations do not create future laws. Without an explanation of why something happened, the pattern you observe may be misleading. Furthermore, you cannot simply make an observation. Each observation is theory-laden. This is a somewhat cumbersome term that claims you must have an idea about what you want to observe in order to make an observation. This idea of what to observe is a pre-existing theory that allows you to see the data as meaningful. Sometimes the explicit theory is hidden from the scientist.
If science operated on an inductive basis, we would be limited by observations and measurements alone. We would not be able to explore the unobservable realms of reality. Knowledge is creative and can therefore explain things we may never see, such as black holes or atoms. We don’t need to see them; we only need a good explanation for them. According to induction, knowledge comes from outside the world. However, Deutsch argues that it is the other way around. According to him, knowledge comes from within the human mind through the process of formulating and falsifying theories.
Finally, you can forget everything we have learned so far and throw it out the window. Verification, falsification, reach, good explanations, and all the rest are torn down. Follow Paul Karl Feyerabend and his anarchy model from the book Against Method: Outline of an Anarchistic Theory of Knowledge5. In short, there is no scientific model. Everything goes. Feyerabend believed that falsification can kill great ideas before they have a chance to flourish. Additionally, many explanations offer more possibilities, providing more room for new thoughts and knowledge generation. Generally, it was the outlaws, such as Galileo, Einstein, and Newton, who brought new ideas and theories into being. Therefore, any structure in science is false. Science is an anachronistic process.
1.1.3 Wheel of knowledge
So far, we have explored several different scientific philosophies. Besides the question of which philosophy is true—which is a different question altogether—we want to ask: Is there a process in science? Is the generation of knowledge a linear process, a piling up of knowledge, or more of a journey through knowledge?
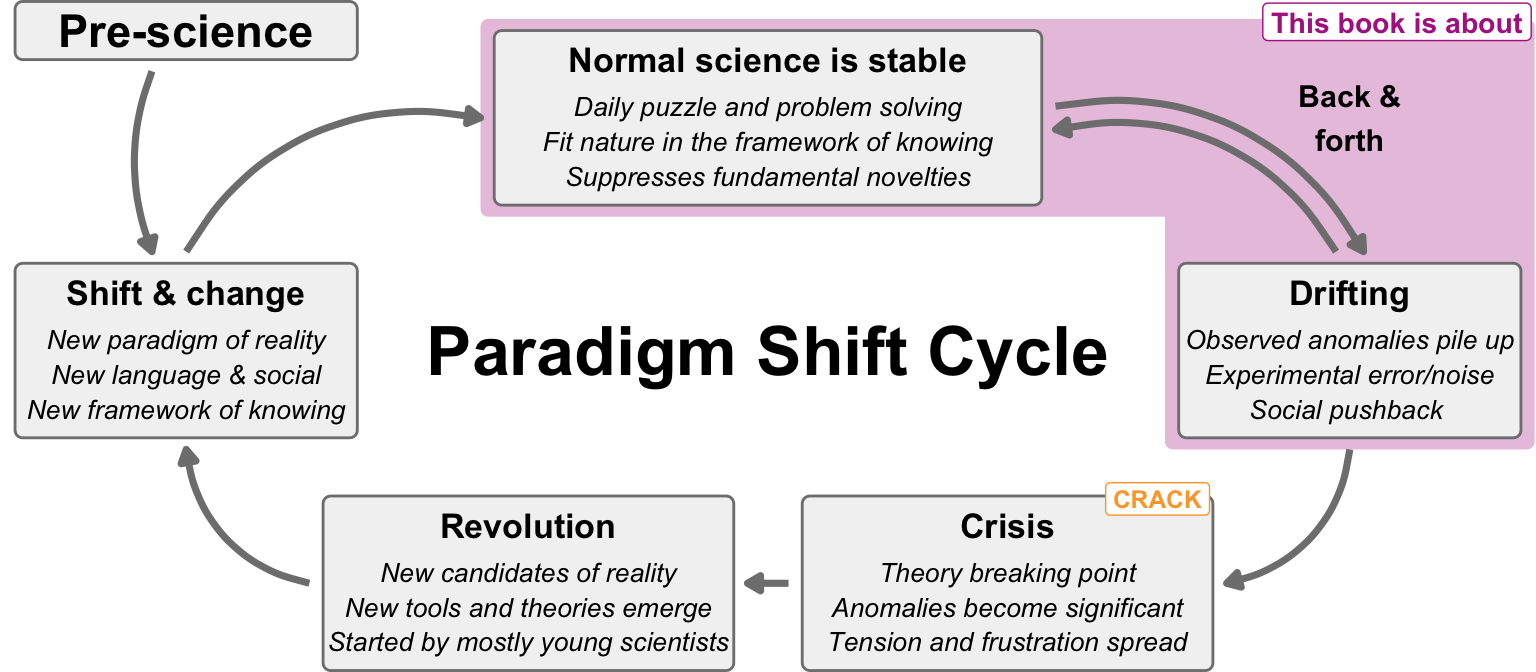
In his book The Structure of Scientific Revolutions8, Thomas S. Kuhn proposed a revolutionary idea about how knowledge is generated. Figure 1.5 shows that knowledge generation runs through cycles. There are stable states of science, known as normal science. In this state, scientists solve puzzles and problems within the existing framework of knowledge. These ideas are socially accepted, and fundamental novelties are passively suppressed by the system itself. Everyone is doing their work, and that’s fine. From time to time, however, anomalies in models or observations occur. We see a drift away from stable science. At first, it is a back-and-forth, but as more and more anomalies pile up, it becomes clear that something is going on. These anomalies cannot be explained by experimental errors or noise in the measurements anymore. There is social pushback, but it becomes weaker.
Then, we observed a crack in the system. A crisis arose. This is the breaking point of the theory. The observed anomalies became so severe that they could no longer be ignored. Tension and frustration spread through the scientific community. Next, new candidates of reality emerge. We see new tools and theories from mostly young scientists who want to start a revolution. Science shifts into a new state of reality, adopting a new language, social structures such as journals and conferences, and a new framework of knowledge. We establish a new paradigm. From there, we enter another stable phase of science. This cycle runs endlessly. We are not just piling up knowledge; it is a process of moving through it.
Therefore, the central idea of Kuhn is the paradigm shift. Every science has a paradigm that holds everything together. The social aspect is also important. Science is done by humans within a social structure. Within a paradigm, some thoughts are permitted, while others are considered fundamentally wrong. Therefore, in a stable, normal scientific environment, new fundamental changes do not occur. Scientific careers are shaped by the paradigm, as are funding and resources. If you want to do something new, you will have to face resistance.
Another key point of Kuhn’s idea of the paradigm shift is the incommensurability of paradigms. Incommensurability is a difficult word that means something cannot be compared. “Incomparable” is a simpler word that means the same thing. We can compare Newtonian mechanics to Einstein’s general relativity. Both paradigms describe the effects of gravity on bodies in space. However, Newtonian mechanics does not explain why gravity works. Einstein introduced a geometric view of the effects of gravity in four-dimensional space, introducing not only space, but also spacetime. The two theories are incomparable and cannot be used together. Only one can be true. Einstein’s theory produces better predictions in extreme situations and is therefore better. But, returning to Deutsch, Newtonian gravity still works and provides explanations for everyday problems. We can use both.
So far, we have not clearly defined what science is. However, in Kuhn’s cycle, there is also a state of pre-science. For humankind, this would be the phase before the Age of Enlightenment (1687–1789), when myths, alchemy, cults, and witchcraft dominated. There were rules of thumb and other farmers’ rules that structured some knowledge. If something worked, it was more or less due to luck. However, even witchcraft has rules and, therefore, a paradigm for working with its statements. Later in this chapter, we will introduce some cults of pseudoscience and their structures.
NoteCurrent crises in science in the 21st century
Okay, this sounds very theoretical. But what is science, and how do we do it? I see your point. Now, we will take a step further and find out what the three pillars of scientific research are. Then, we will determine in which pillar your daily scientific work mostly falls. Then, we will talk about science and how to practice it. I know it’s a long journey.
1.1.4 The three pillars of scientific research
Everyone likes pillars, so we have three pillars of scientific research. The first is theoretical science, the second is experimental science, and the third is instrumental science. All three types are more or less interconnected. Don’t ask me how the pillars can be interconnected, but sometimes pictures are misleading. Figure 1.6 shows the interaction between the three fields.
So far, we have mainly discussed theoretical science and its underlying philosophy. Theoretical science is the brain of knowledge generation. We conduct thought experiments and generate ideas. We also produce new algorithms, mathematical tools, and conceptual models. However, we don’t build or test anything in the physical realm. Therefore, theoretical science suggests experiments for experimental science and provides blueprints for instrumental science to test and build.
Experimental science is the daily work of most scientists. We gather empirical data and test models and theories. Often, the work is much smaller in scale, and theories are not touched. Our goal is to observe effects or differences between groups, predict outcomes, and explain systems by identifying patterns in data. Therefore, we need the support of instrumental science if we want to observe new parts of reality that were not technically available until now. We often use devices that have already been built.
Instrumental science is the driving force. There, we produce new machines with better sensors that can observe things that were previously unobservable. We use the ideas and blueprints of theoretical science to build machinery. However, the daily work of scientists involves the small parts and technical implementation. Our goal is to produce new, more precise, or more efficient devices than those already in existence. Sometimes, we need smaller or more reliable machines to conduct better experiments and prove theories.
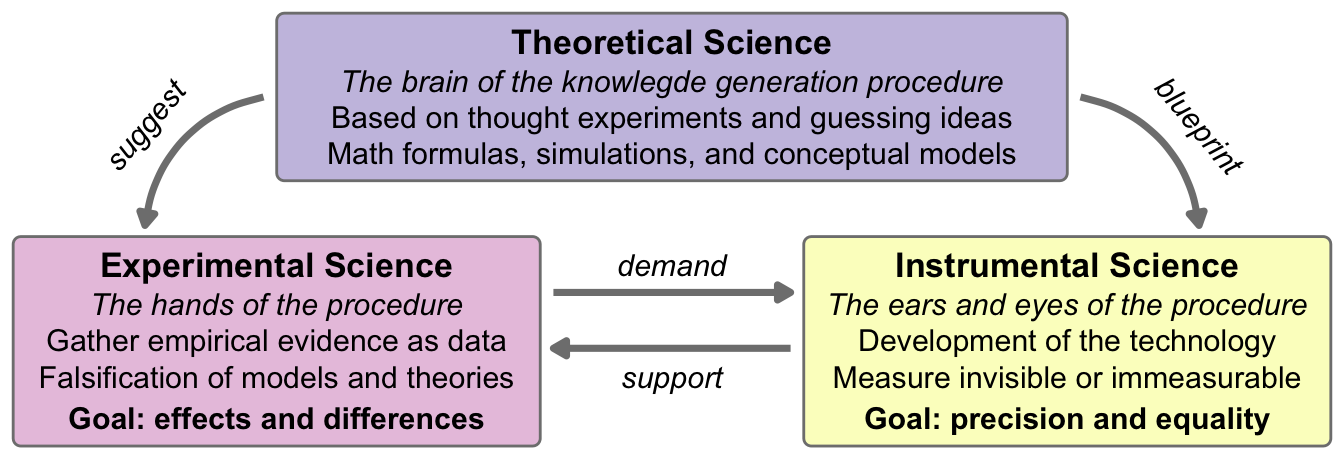
Experimental and instrumental science are less influenced by philosophy than theoretical science. Experimental and instrumental science is essentially the working force of science. They would have nothing to do without an overarching theoretical idea of how instruments should be built and experiments carried out. The theory determines how an experiment must be designed to be testable and falsifiable. This gives us an idea of which instruments we need and how we can build them. On the other hand, we discover interesting anomalies when we build things. Things that should theoretically work do not. Solving such anomalies in the building process can generate new ideas about why things happen. Therefore, all three pillars require a constant flow of ideas and interconnection.
1.2 Typology of science
Now, we can shift our focus to the practical considerations of how we want to conduct our research. We have already discussed the theoretical background. However, the topology of science is still open to debate. What is science? What types of science are there? What is the opposite of science? These are all questions I like to consider. Next, we will discuss how to do science. One topic I will leave open is the reason why we do science. I assume that you are interested in science or feel the need to do it. You will do science regardless of the arguments. Then, let’s start with the distinction between science and non-science.
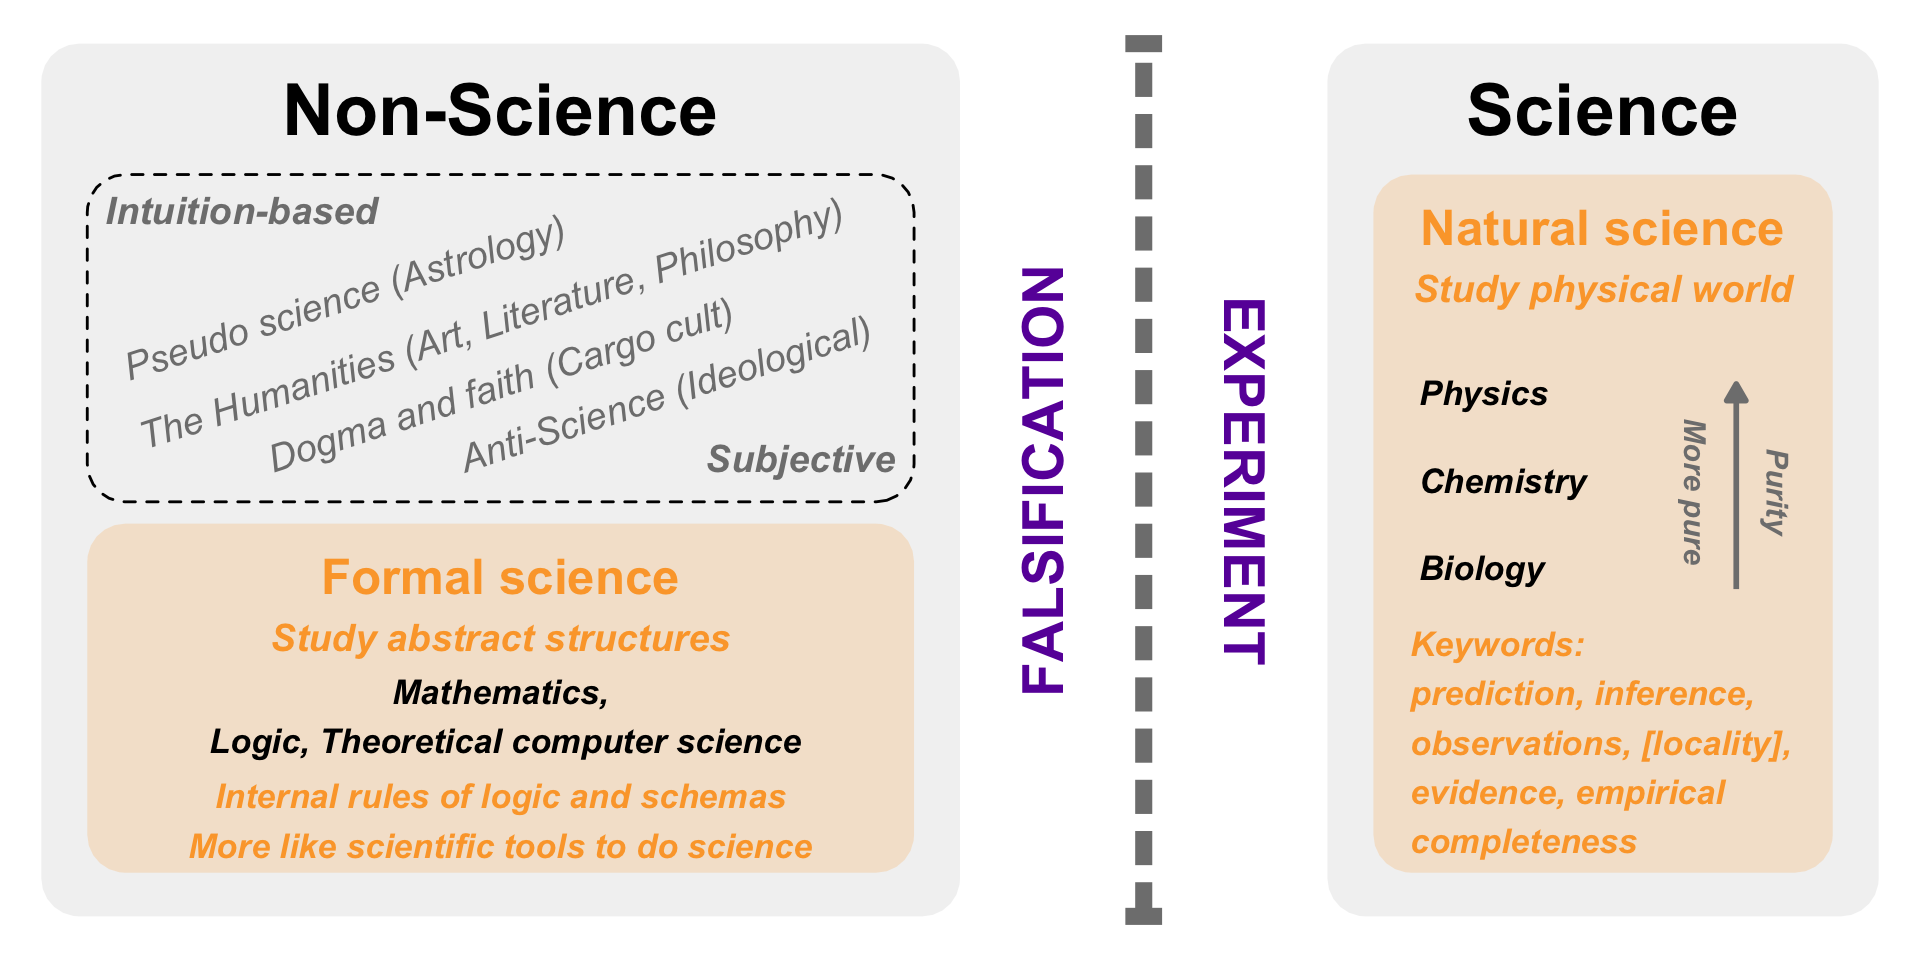
The following Figure 1.7 shows the demarcation line between science and non-science. In the next sections, we will discuss each specific part, but I think it’s important to start with a clear overview. Science is distinguished from non-science through experimentation and falsification. This is true in this book. There are many subtle definitions, but I will keep it simple here. If an experiment is not possible, then it is not science. We also need the ability to build a falsification framework. Therefore, we need hypotheses that can be rejected by experimentation. These two requirements are met by the natural sciences, including physics, chemistry, and biology, in order of their purity. Biology includes medicine and all other fields of knowledge gathered from living things. In addition to natural science, there is formal science, which can be seen as a tool of science. This is due to the lack of experimentation, falsification, or both. Therefore, we will not include mathematics, logic, or theoretical computer science as sciences. True non-science fields are intuition-based or subjective at their core. There are many of these fields, and we will discuss them shortly. The humanities are undoubtedly different from non-science, but this book is not about the humanities, so we will put them aside.
You could also consider formal science a structural science. These fields study abstract structures and the rules that govern them. They deal with forms such as logic and syntax rather than physical matter or reality. Therefore, we can describe natural science as a reality science. Empirical science would be better, but I personally find reality science more appealing and easier to understand. Reality science refers to the study of the actual, observable world. In this book, we will learn more about statistics because they provide a mathematical structure. However, when you use statistics for study, you are engaging in reality science.
Perhaps we should start with the supposedly easy part. What is the opposite of science? In doing so, we will gain an understanding of the term “science” and what it means to us. This may be the deepest lesson for me: we cannot really grasp science. Science is connected to each person in a different emotional way. Science seems cold and rational, but humans are not. Therefore, our relationship with science is strange and complex. Science is its own way of thinking, perhaps a philosophy. Therefore, there are as many ways of thinking as there are human minds.
1.2.1 The opposite of science
As I found out, there is no direct opposite of science. That’s interesting. Sometimes, you can define something by knowing what it is not. You might think this is not so problematic. Take a few minutes to ask yourself: “What is the opposite of science?” Okay, good to have your focus back on the page. Maybe you thought science was cold and rational. I will share my personal story with science. For me, science was Star Trek: Enterprise. But I’m too young for Kirk and Spock. So, I was socialized with Captain Jean-Luc Picard and Star Trek: The Next Generation (TNG). That’s where I first encountered Shakespeare, but that’s another story. In TNG, science was determined by the exploration of new worlds. I would sit comfortably on the open bridge in front of the gigantic viewscreen. Commander Data was the embodiment of science. He was an android. He was rational and cold, devoid of emotion and humor. Let’s flip these attributes.
If an android is science, then what is a human? Then is the human the opposite of science? Perhaps there is some truth to that. Humans have lived on this planet for thousands of years, but science as we know it began during the Enlightenment. So perhaps humans are the opposite of science. Human beings are full of emotions and feelings. Each one is very subjective and interested in their own development. They feel love and romance. Neither of these is very scientific. Humans also believe. Some believe in a more structured manner, like in big churches, while others believe in a more individual manner. However, believing in something has nothing to do with science. But humans do science. Therefore, science is part of humanity. As Joshua Schimel said, “Knowledge is a product of human hopes and fears. Our emotions are crucial to its development, and it cannot be truly understood as some bloodless, emotionless enterprise.”15 Science is a human endeavor.
According to Arthur C. Clarke’s Third Law, “Any sufficiently advanced technology is indistinguishable from magic.”16 Is magic therefore the opposite of science? We cannot perform magic. We do not have the power to do so. However, some humans believe that we can perform magic. Who is “we”? The advanced part of humankind. We come into contact with our brothers and sisters who are at a different technological level, such as tribal cultures on isolated islands in Indonesia. To a tribe with a primitive culture, our technology seems like magic. Here, we can observe the cargo cult. A cargo cult is named after its appearance in World War II. The US Army faced the challenge of determining the best island-hopping route to mainland Japan. Since no one knew and the tides of war were constantly changing, the US Army Logistics Corps decided to drop cargo everywhere. This way, if US soldiers approached an island, there would already be plenty of supplies.
What happened to the indigenous population? They believed that the gods had come to bring them cargo. They could not think of any other explanation for what they observed. They observed hardened silver birds dropping and landing on the islands. After a while, the gods stopped showing up. The war was over. But nobody told them. Therefore, the people of the islands copied the gods’ behavior. They built the control room, and they made a radar station out of grass and wood. They even built plans out of grass. Nothing could work. They did everything perfectly, but they missed the point entirely. It was a cargo cult, not science. They copied someone else’s routine and hoped to experience what the gods experienced when they did the same.
Do you follow a cargo cult in your daily routines? Do you do things that you have seen but don’t understand? Do you believe that they will work even though you don’t know why? This is totally human and from my point of view totally necessary to be a working community member. Some stuff must be done, even if I don not really understand the why. But what if we do it in science? Then we will do cargo cult science17. It is a danger of enormous proportions if done in the wrong place with the wrong intentions. Still, most intentions are good and are twisted by the circumstances. There are several examples of following dogmatic rules and getting a catastrophic outcome. Later, we will explore different models of reality, including the Fukushima nuclear accident.
For now, I would like to conclude that the opposite of science is difficult to grasp. On the one hand, we could argue that human emotions and feelings are the opposite of cold, rational science. However, emotions are also the driving force behind human scientific inquiry. Therefore, we are doing something scientific by leaving the topic open for further research and looking for things that are not science.
1.2.2 Pseudoscience as a chimera
Besides things that are the opposite of science, there are things that are similar to science or that use attributes and tools in a distorted way to imitate science. Conspiracy theories18,19 look like science and use science terms and tools. They play on a stage that looks like science but has no deeper foundation. It’s more like a nice story about humans harming other humans. However, conspiracy theories attempt to explain the world and often generate money for the storyteller. Therefore, I do not see conspiracy theories as the opposite of science. These conspiracy theories are non-science. Some theories have a historical basis, such as the hollow earth conspiracy theory. We will discuss the origin later. Conspiracy theories like to be retold, and in the process, they grow and multiply. To circumvent the proliferation of conspiracy theories, I will provide an illustration of the anti-conspiracy theory “Birds Aren’t Real” by Peter McIndoe.
What does the movement claim? In short, the US government kills all birds in the US and replaces them with bird-looking drones. Birds sit on power lines to recharge and defecate on cars to mark them visually. The bird drones are there to spy on American citizens. The specifications are inconsistent and vary. This is a typical sign of a conspiracy theory. Finally, U.S. President John F. Kennedy was assassinated by the government due to his reluctance to kill all the birds as cherry on top.
What do conspiracy theories have in common? They all tell a good story. I personally find them more similar to fairy tales, with the standard Greek dramatic structure of one hero against an anonymous horde of evil. In addition, they all have in common a lack of experiment. They don’t even conduct a small experiment or propose a hypothesis to test. A testable hypothesis is rarely claimed. Even if a hypothesis is present, the story can easily be changed to maintain its purpose: to tell a good story. Here, we will not focus on conspiracy theories and how they work. This topic is beyond the scope of this book.
There is another field in which personal stories are the focus. Psychoanalysis uses direct dialogue between two people to help one of them. In psychoanalysis, there are also no experiments. History knows of long debates about whether psychoanalysis is a science or not, or to what extent. Psychoanalysis shares a similar fate to the Humanities in general. They are not considered science in the scope of this book either. Just because something is not a science does not make it bad. Many important things in life have nothing to do with science.
1.2.3 An approach to “real” science
So far, I have discussed the opposites of science and pseudoscience. We have considered what science is not. However, I must be careful because, as Paul Feyerabend correctly stated, science should be anti-dogma. Therefore, science is a beautiful, messy, human adventure that cannot be put in a box or a closed framework. Perhaps he is right, yet I will do my best to achieve this goal for the book you are reading. Ultimately, you are free to choose your own worldview and science.
Now, I would like to clarify what science is. Figure 1 shows that science is divided into two parts: natural science and formal science. The natural sciences include physics, chemistry, and biology, among others. Biology encompasses all life sciences. The other category is formal science. Here, we see formal science as the tools used to do science. The main fields of formal science are mathematics, logic, and theoretical computer science. Why is there a difference? We decided that science must have experiments and follow the falsification principle. In doing so, we distinguish mathematics and other theoretical sciences as tools from natural science. This is now our working stance.
Experimentation and falsification are at the core of science. Together, they form the demarcation line that determines whether a field or activity can be considered scientific. This line is used to determine if a field belongs to the natural sciences. However, we cannot reject an experiment. Either an experiment takes place or it does not. A testable hypothesis, however, can be rejected. In this book, we will use formal sciences, such as mathematics and logic, to study the natural sciences. We need formal science as a tool.
I know this distinction between formal and natural science seems unpleasant. However, we now have a clearer definition of science and its properties. Most of these properties are not shared by formal sciences. Therefore, with this distinction, we have a clearer picture of what we are doing. Again, the humanities are a victim of these definitions, but I will pay the price for the gained structure.
If we repeat an experiment, we should see the same results. The reproducibility of an experiment is crucial for science. We have a severe problem if we cannot replicate the results of an experiment elsewhere or with someone else. The conclusions of experiments should be generalizable across time, space, and the individuals conducting the experiment. Here, we have the restriction that, although better technology might increase precision, the fundamentals should stay the same.
In an experiment, we are interested in prediction of future observations, or we want to perform inference and explain causal effects. This is our goal. We want to determine algorithms that can predict observations with partially unknown properties, or explain measurements. We use objective, numeric approaches to make decisions. Our connected experiments limit us to a small range of testable hypotheses. Therefore, we must know what we want to test and report. Is our scientific approach relevant to our work, patients, or other areas?
We need evidence. An evidence-based approach means making decisions based on solid scientific evidence, the latest research findings, and expertise rather than relying solely on opinions, traditions, or personal experience. We reject storytelling and myths from various sources, even if those sources are considered authoritative. A scientist’s status is meaningless to us. Only experiments and their results are important. However, science has a hierarchy, so fraud and theft will happen.
Our conclusions are based on observations and measurable results from an experiment or data collection. Therefore, we are limited to the available or collected data. If we forget to measure something, we will have a missing piece of information. Sometimes, information is lost accidentally. This may cause us to repeat the experiment many times. We believe that the observables in our experiment are beables in reality. Therefore, an observed thing has a real physical representation. Although we may observe random representations of populations or probabilistic realizations, there are still real beables behind these measures. This distinction may seem overly sophisticated most of the time, but it is important to a realist that observations are real.
We are performing empirical science. We have the following empirical cycle: First, an observation causes a scientific question, followed by a hypothesis, experiments, data analysis, and a conclusion. This is often referred to as the scientific method. There are many different cycles and processes. They all have one thing in common: we first encounter something curious, which sparks a hypothesis about it. Then, we conduct experiments to test the hypothesis and reach a conclusion through data analysis. A hypothesis should be testable through experimentation. The experiment should be designed so that the hypothesis can be rejected. We need falsification. Additionally, the experiment should be reproducible.
The last two are slightly more rare and have already been rejected. They are the completeness and locality criteria20. By completeness, we mean that every element of physical reality must have a counterpart in physical theory. Locality describes how only local effects can influence one another. There is no possibility of faster-than-light interaction between particles. Both have been shown to be incorrect in nature21. However, physics still respects the cosmic speed limit for data and information transmission. If you work in a typical laboratory that has no connection to quantum effects or gravity at near the speed of light, you can disregard these facts for your research. But it’s still fascinating to me.
1.3 Get science done
How should science be done? There might not be a bigger question. It’s the elephant in the room. Perhaps you are already doing scientific work, or perhaps you want to start doing science, which is why you are reading this book. Either way, I will now try to help you answer it. First, science is a human endeavor and therefore very individual. Everyone has their own way of figuring things out. My approach is Zinsser’s “writing to learn” method22. But you only see the final result. Most of the thinking is done on paper through drawing and writing. The pen is mightier than the keyboard23. However, this doesn’t explain where my ideas come from. I must admit that most of my ideas emerge during my free time. This happens when I’m doing boring tasks and thinking about this or that. Sometimes, an idea hits me. I write them down and think about them some more. I conceptualized most of this book on playgrounds and at children’s gymnastics, where my presence was required, but not my acting skills.
From now on I had also to do a harsh decision. Science is broad, this book is in contrast slim. Therefore I will focus on the natural science. Especially, the life science, which includes all living things. Yes, some parts will also applicable to more technical fields like mechanical engineering and engineering sciences but only in a limited way. A building and the humans inside does not accept a error in its structure.
Sometimes a structure is necessary because starting from scratch with no ideas is the most difficult. However, there are dozens of pathways for doing science that have been described. If you are new to the field, it might help to consider one of the more modern approaches. Often, beginners feel overwhelmed by the available information in one field. Therefore, it might be better advice to start by doing something instead of thinking about a topic for weeks and getting lost.
The following figure illustrates the scientific method within a stable scientific environment, as defined by Kuhn8. The paradigm is set. There is a closed framework within which we will conduct our research. Therefore, we are more or less safe. At the academic level of final theses, we often receive the scientific topic externally. Thus, scientific work focuses on steps two through seven. Often, many new hypotheses arise after we finish our first analysis. It’s normal for an experiment to produce more questions than answers, like a beheaded Hydra. In an ideal world, your findings would always be externally validated by other scientists. Often, this takes much longer than your original work. If you leave science after step seven, you may never hear about validation from others. These steps are highly structured, and, in my opinion, very helpful for beginners. Real scientific breakthroughs do not happen on such a safe, structured path. I fully agree with Feyerabend’s anarchist views5. If you aim to create a scientific earthquake that shatters people’s beliefs, do not use patterns like the following.
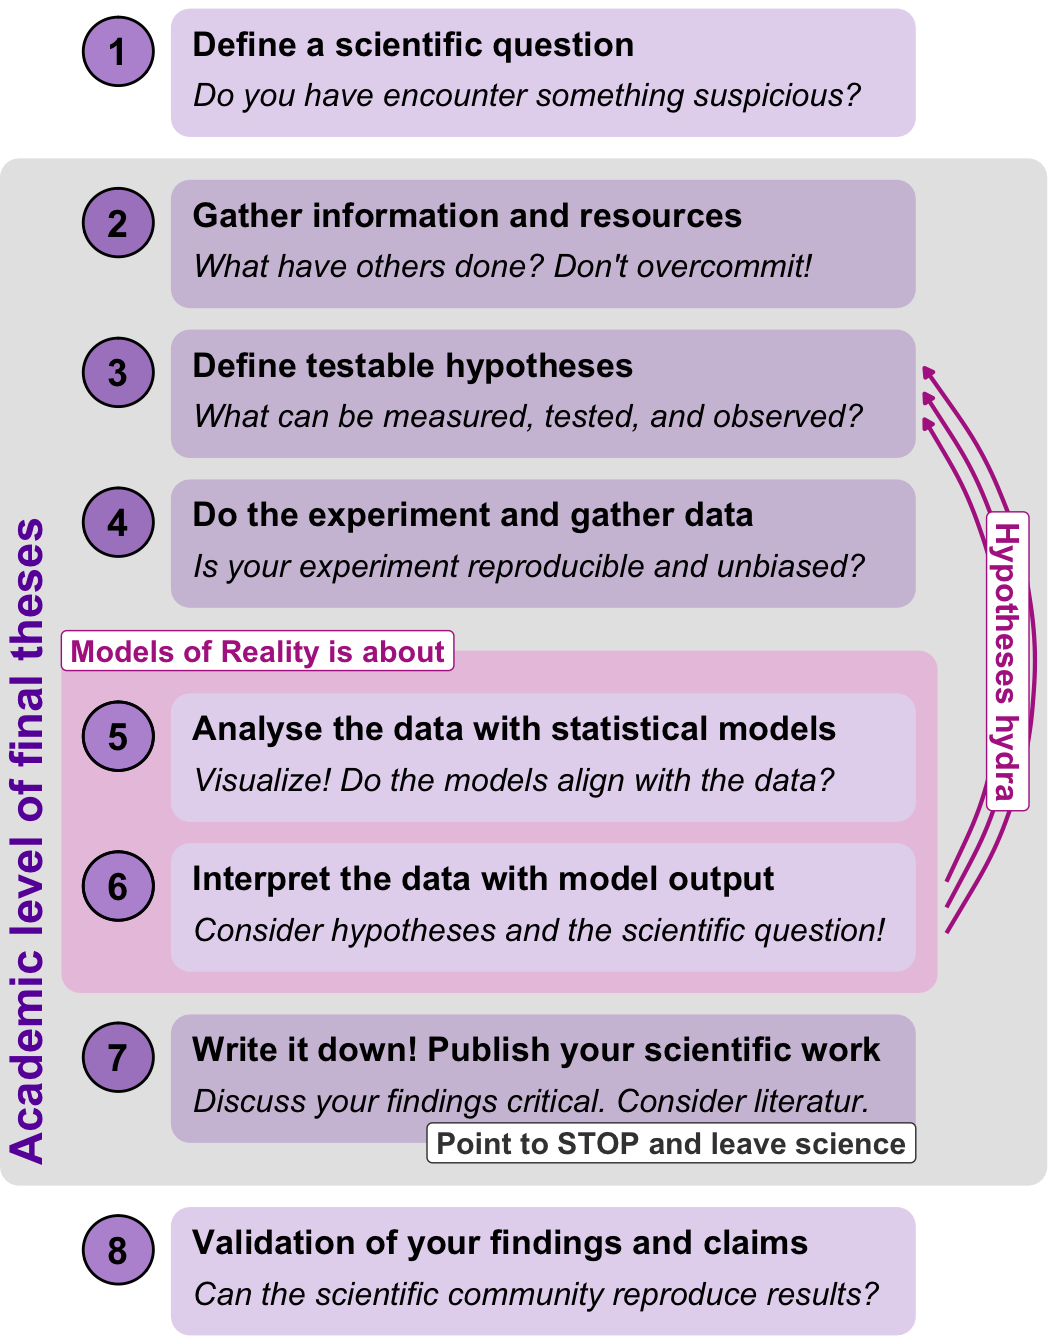
I must admit that there are other scientific processes out there. The scientific method has many faces, which is another sign that science and working with science will never fit neatly into a bureaucratic framework. It makes sense to provide some guidelines for undergraduates. The above structure provides a framework for what you can do in a stable scientific environment.
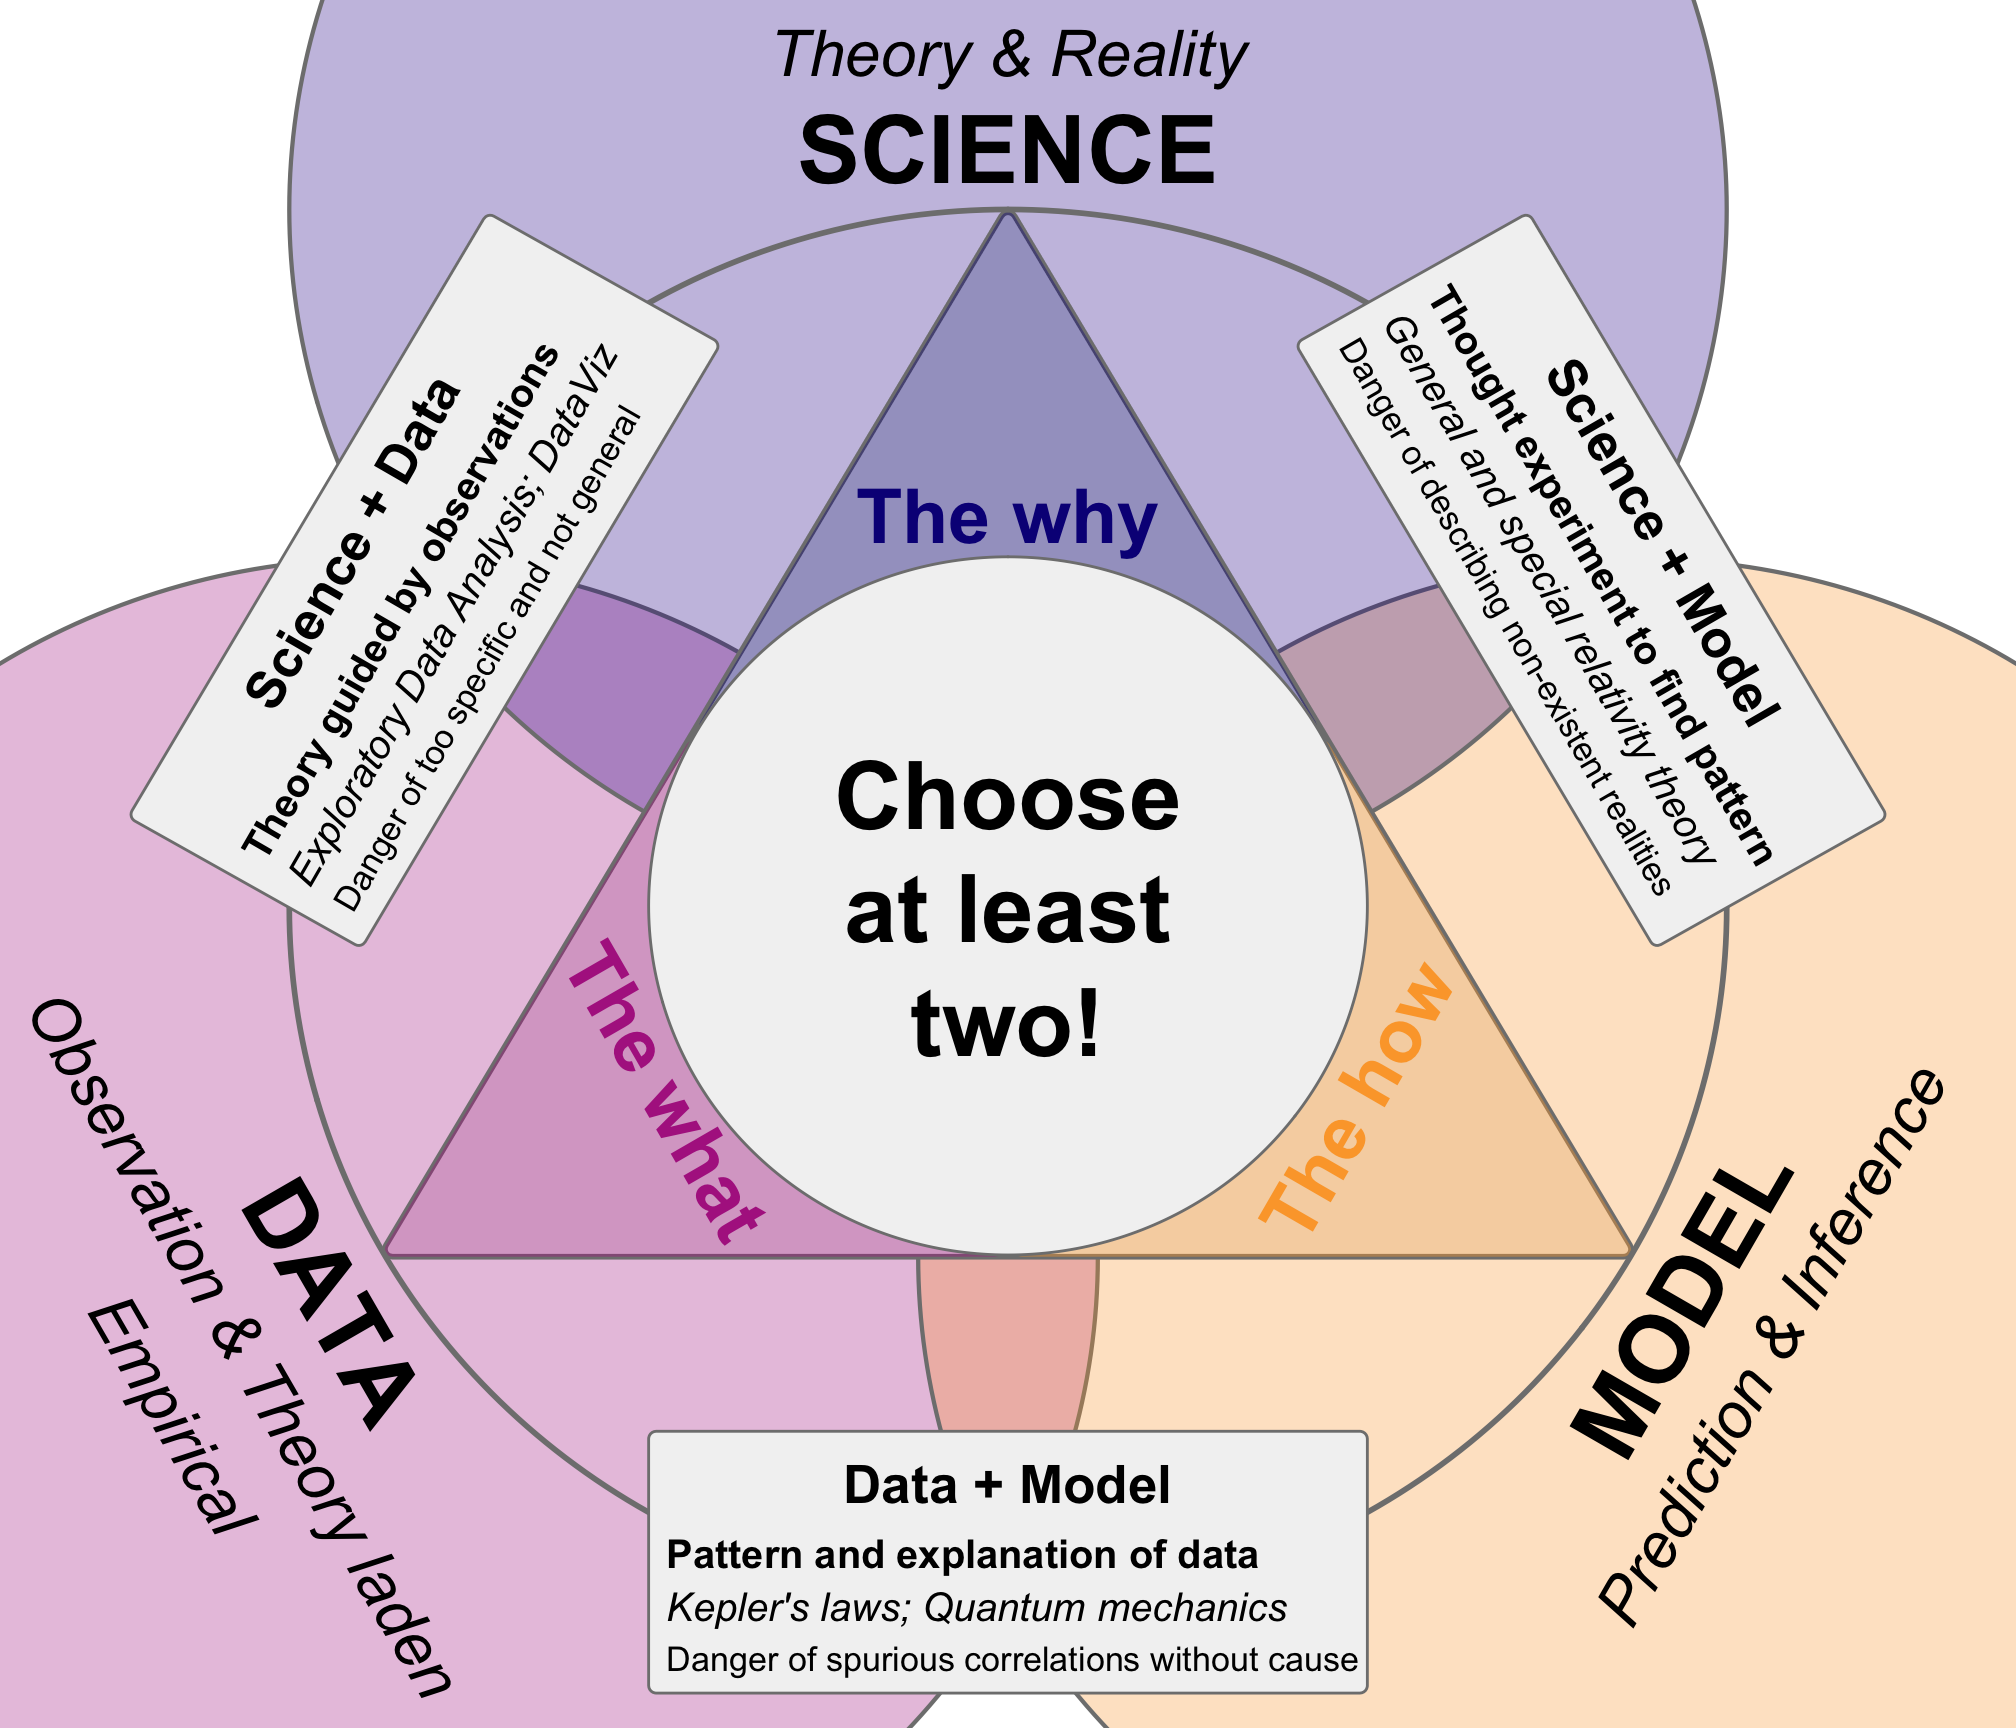
Figure 1.9 attempts to categorize the three fields of knowledge generation. At the top is science, in the lower left corner is data, and in the lower right corner is the model. To generate knowledge, you must select at least two of these three categories. While you can use all three, often two are enough to make meaningful progress in your daily work. You can practice science only with data. Therefore, you are doing data visualization or exploratory data analysis. You visualize your data points, dependencies, and patterns, and try to make sense of them. This is very common nowadays because we have the computational power to draw these plots repeatedly. In the 19th century, this was not possible. Drawings would take too much time and were only used to get an idea of the data. This is a remarkable development.
Furthermore, we can combine science with a model. Therefore, we don’t produce data from experiments; we only conduct thought experiments. We think about dependencies. We also consider what we observe. Then, we use logic to find patterns and make predictions. Another strength of this approach is that we can focus on the unobservable and the unmeasurable during our thought experiments. We are not limited to observed data. Our creative process is free, and we can later test our predictions using experimental data. However, our theories and models must be testable, and our hypotheses must be falsifiable.
Finally, we can look at the data and the analysis with models. We have data, and we have algorithms that can identify patterns within it. We do not really know why things work, but our predictions work on actual and future data sets. This is fine, as David Mermin said, “Shut up and calculate!”6 The greatest danger here is doing things without understanding them. We are not making progress because we do not truly understand why our models work with the data. Nevertheless, we can continue this way for a long time before our current working models might reach their limits. To change our algorithms and tools, we will need a new paradigm. Models and data alone will not provide us with a new one. So choose at least two and start with the work!
Often, a beginner will start by doing something, observing the data, and trying to find a pattern. Then, you can follow the path of Figure 1 and try to make sense of your measurements. But what if you really want to discover something new outside the existing framework of knowledge? If you strictly follow paths and rules, then you have a problem. Creativity doesn’t follow structure or bureaucratic ideas. You must do things differently. Since this is very individual, I can only offer suggestions I found in literature and quotes from others who broke the rules and sought the truth.
Let’s start with Wolfgang Pauli, a pioneer of quantum mechanics and a close friend of Carl Jung. Jung founded the school of analytical psychology and the concept of the unconscious. Pauli defined the scientific method as “taking up a subject repeatedly. Thinking about it. Setting it aside. Gathering new empirical material. And continuing this process for years if necessary. In this way, the conscious mind stimulates the unconscious mind. If anything, this is the only way to achieve results.”24. It’s essentially about sitting in the middle of a room in a chair and allowing yourself to get bored for as long as possible. Doing so sparks creativity. Boredom is a way to come up with good ideas25. This might not be the only way, but many people come up with ideas during their breaks after an intense work period.
“As a scientist, you are a professional writer,” Joshua Schimel said15. Maybe this is the way to do it. Write it down, as William Zinsser suggested in his book Writing to Learn22. Therefore, we use the writing process to organize our thoughts and discover new ways of thinking about what we know and don’t know. Otto Kruse stated in his book26, “many scientific topics can only be solved once all aspects have been explicitly formulated. The mind is not sufficiently prepared for this, as it can only ever focus on small sections at a time. Systematic thinking is only possible when writing, i.e. recording the results of one’s thinking and relating them to other aspects.” Clear writing is often associated with clear thinking. Therefore, we use writing as a process to organize our thoughts. This process may also spark creativity. I use a physical scientific journal in which I draw and write. In it, I organize my thoughts and keep all my printed quotes. I use it as an external brain to create something new from the bits and pieces.
Maybe a more mathematical approach would suit you better. In that case, I recommend the book How to solve it: A new aspect of mathematical method by Goerg Polya27. The general idea is to understand the problem and devise a plan to solve it by finding connections between the unknown and the available data. Here, the data can also be seen as information. Then, we carry out the plan and reflect on what we have learned after trying to solve the problem. The last point is especially important because we want to know what we have learned on the journey. Polya wrote his book for teachers who want to help their students and students who want to solve mathematical problems. The focus is on mathematics, not science in general. However, I found the ideas in the book appealing. Life is somehow about problem solving. The book helps with that.
Perhaps this section lacks a hands-on approach. A guide on how to do science? But I don’t know of any. There are helpful structures from all over that might help at the beginning. Like a colored alphabet with funny animals might help learning letters. So, I can only encourage you to create something. Anything goes!
1.4 Statistics in science
On a warm spring day, I was sitting in my first statistics lecture. It was my second semester, and I didn’t really understood the scientific workflow. I don’t remember everything, but one quote from the beginning of the lecture has stuck with me: “Statistics is the engine room of science.” I think this quote might not have even been spoken in this form. Rather, it was the underlying theme of the lecture.
Is statistics a science? Or is it more of a toolbox of mathematical models used for scientific research? Statistics is a formal science that primarily connects the formal sciences to the natural sciences. At its core, we have randomization and the experiment in which the randomization occurs. Statistics uses two logical and mathematical tools: inductive reasoning and a probabilistic framework. Because we often use inductive reasoning, we focus on what we observe. We are in danger of shifting into logical positivism. Therefore, we must understand these philosophies and avoid them before they harm our generation’s knowledge.
This book is about statistics. It’s about models that try to find patterns in data and explain dependencies. We use statistics to explain biological processes or predict new observations. We utilize statistics as a mathematical tool and apply logic to make decisions between different treatments or, more broadly, hypotheses. All of this takes place within a probabilistic framework, where we must understand and handle probabilities. We will explore different types of probability later in this book. So far, we know of three types. Probabilities based on frequentism require replication. You count how often an event happens and divide that number by the total number of attempts. Frequentist probabilities are the probabilities of the gambler. These are the probabilities we learn in school. On the other hand, there are probabilities of personal belief. We somehow know the probability of an event. These probabilities are called Bayesian probabilities. Finally, we can examine propensity probabilities. These are not truly mathematical probabilities. Is there a probability inside a coin, even if no one has ever thrown it? What is the coin’s tendency? Karl Popper attempted to answer this question using propensity probabilities.
NoteWill it rain in a probabilistic framework?
If you like riding your bike and live in the Northern Hemisphere where rain is always uncertain, then you will often look at the weather app on your smartphone and ask, “Will it rain?” Almost every weather app shows the probability of rain for each hour.
- Frequentist
-
Observe the weather conditions, such as temperature, wind, clouds, season, and air pressure, at the given hour. Compare your observed conditions to equal conditions. Count the number of rain. Then, divide that number by the total sum of rain and no rain for those conditions. Classical: How much does the event rain in the total sum that occurs? There is no such thing as a probability for one observation. You need frequent observations in order to calculate a probability.
- Bayesian
-
Given your prior knowledge of rain under the current weather conditions, such as temperature, wind, clouds, season, and air pressure, what is the probability of rain at this hour? The probability of rain is a combination of your prior experiences and the actual conditions. Therefore, it is a subjective probability. There is a probability for one observation. This is true if you have prior knowledge of whether it will rain.
- Propensity
-
It will rain or not rain this hour, regardless of whether you are observing and measuring. There is an internal probability of rain under the current weather conditions, which include temperature, wind, clouds, season, and air pressure. In reality, this probability changes every second because all of these conditions are constantly changing. There is an inherent tendency for it to rain. You can describe this tendency using probability.
Because it is helpful to have a different approach to ratios, we can also define the odds or chance. It’s similar to probability, but the interpretation is different.
- Chance or odds
-
The chance of rain is defined as the ratio of observed rainy hours to non-rainy hours under current weather conditions. Unlike a probability, we are not interested in the number of events divided by the total, but rather the ratio of events to non-events. In order to determine the odds of rain versus no rain, we need observations. It is impossible to determine the odds of rain based on one observation.
To make matters worse, there is another aspect of statistics to consider. It is not a mathematical probability, but it is very important in statistics. We call it the likelihood, which I prefer to translate as “plausibility.” So far, we have examined the data and observations of rainy days, as well as the conditions on those days. We will likely look at the model or the rules to determine the probability of rain.
- Likelihood
-
How well do the rules of our model align with the observed rainfall? In other words, does our model, which includes the calculation for the probability of rain, fit our observation? We compare different rules in a model and choose the ones that best fit the actual observations. The comparison is made using the likelihood. The higher the likelihood, the better our model predicts rainfall. The likelihood describes how well our model can predict rainfall. If the likelihood is high, we can make accurate predictions about rainfall regardless of whether it will rain. The likelihood describes our algorithm, not the data.
Confused? That’s normal because we humans don’t live in a probabilistic framework. This is one of the cognitive challenges when you start studying statistics. You have to deal with probabilities and related concepts.
What will we do? We will learn how to model data. We will try to understand how to find patterns or meaning in data. Ideally, we will have a scientific background, meaning we will have a “why.” Other times, we only do the modeling and are happy if we find any pattern. Sometimes, patterns are rare, or the relationships are more complicated than we thought. Life is difficult, and science is no better. In this book, we will use Fisherian statistics, which is inductive reasoning based on logic. In other words, it is the logic of inductive inference. Because we use repeated samples and a special type of probability, it is called frequentist statistics. There is also an older branch of statistics called Bayesian statistics. Bayesian statistics predates Fisherian statistics, but it is not as simple mathematically. Bayesian statistics is based on inverse probability and can only be solved with modern 21st-century computer power. Fisher rejected the subjectiveness of inverse probability28. However, I don’t think he ever used them, so we could reject them as well. Nevertheless, Fisher switched from a mathematical deductive reasoning to a inductive reasoning in science. This is remarkable for me, because he changed the way he does science. We will come back to these topics later in the book.
Data science is a bridge between formal and natural science. The term can be misleading. It is not the combination of data and science, but rather the combination of data and models. In the following chapters, we will learn more about data and then statistical modeling. Data science uses statistics to make predictions even when the underlying reasons are unclear. It is important to distinguish between data from planned experiments and data from observed real-world phenomena. Real-world data does not emerge from a planned experiment and must be treated differently. The next chapter provides more information on data.
Therefore, we conclude that statistical thinking is inductive. Figure Figure 1.10 shows a simplified process for generating statistical knowledge. Since statistics is a formal science, the process is pure and does not involve any real hypothesis. In theory, statistics can be performed without any hypothesis whatsoever. However, we do need theory-laden hypotheses if we are working in the natural sciences. Statistics can be applied to many scientific fields. First, we have experimental data. Sometimes a hypothesis is connected to the experiment, but not always. Often, the hypothesis is neglected or forgotten in the process of generating data. Sometimes, we find the hypothesis at the end of our journey. Then, we use statistical modeling as a second step to find meaning in the data. Roughly speaking, we try to fit a line through the data points. Finally, we can draw conclusions from the statistical model. We can choose between decision-making, which includes group comparisons, or explanation, which includes prediction. The entire process is probabilistic. Experimental data is a random representation, and decisions are also based on probabilities. Randomization and random observations are crucial to statistical reasoning.

In this chapter, we will not discuss the topics of Fisher and statistics or probability in depth. We will address these interesting topics later. Therefore, I must apologize. This chapter was about science, but we will not really be doing science in this book. Following my own definition of science, statistics does not belong to the natural sciences. To be honest, common sense says that natural science is a science. However, you can do science in your field.
NoteDerivation of the formula for kinetic energy
Inductive reasoning seems a bit difficult to follow. Therefore, I conducted a small experiment to derive the formula for an object’s genetic energy, focusing on velocity. To make things easier, we will keep the mass constant. The formula is well-known; Newton discovered it. The formula for kinetic energy is \(E_{kinetic} = \tfrac{1}{2}mv^2\). Therefore, we will take the mass of an object in kilograms and multiply it by the square of the velocity. Velocity is defined as follows: \(v = \tfrac{d}{t}\). We divide the distance traveled by the time it takes the object to travel that distance. Now, I want to find the dependency between velocity and kinetic energy. To do so, I built the following apparatus. A \(30\)-gram (\(0.03kg\)) ball lies on a height-adjustable tower. The ball will travel a ramp without friction, covering a distance of \(60cm\) (\(0.6m\)) to the ground. At different heights, we will measure how long it takes the ball to reach the ground. Then, we can calculate the velocity in each trial. We know the ball’s energy at the top. At the top, we find the potential energy with \(E_{potential} = mgh\). We will multiply the ball’s mass by the acceleration due to gravity, which is \(9.81 m/s^2\), and the height of the tower. Since we are changing the height, the ball’s energy will also increase.
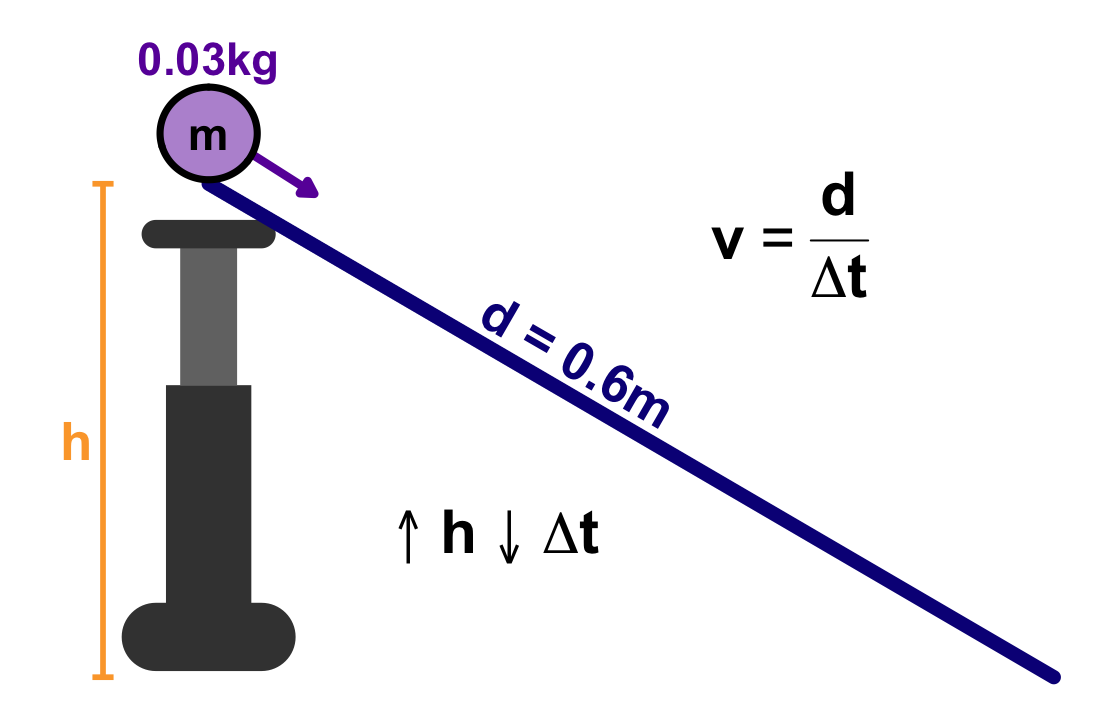
Let’s write everything down. We have the mass of the ball, \(m = 0.03kg\), the length of the ramp, \(d = 2m\), and the acceleration due to gravity, \(g = 9.81 m/s^2\). We put the tower at five different heights and let the ball roll. The ball runs surprisingly fast. Because we cannot perfectly adjust the height, and manual time measurement is error-prone, we obtain noisy velocity measurements. The observed data has an error. The table Table 1.1 includes the measured and calculated data.
| Height [m] | Potential energy [J] | Time [s] | Velocity [m/s] |
|---|---|---|---|
| \(0.1\) | \(0.1 \cdot 0.03 \cdot 9.81 = 0.029\) | \(1.58\) | \(2/1.58 = 1.27\) |
| \(0.2\) | \(0.059\) | \(0.95\) | \(2.11\) |
| \(0.3\) | \(0.088\) | \(0.85\) | \(2.36\) |
| \(0.4\) | \(0.118\) | \(0.65\) | \(3.09\) |
| \(0.5\) | \(0.147\) | \(0.72\) | \(2.78\) |
A table of data is nice, but most of us cannot really see anything in a table. Therefore, we will visualize our data throughout the book. The Figure 1.12 displays the five data points for the energy of the balls and the final velocity. The blue line shows the result of a statistical model. I ran a nonlinear regression to find the perfect line through the points. How did I do this? We will discuss modeling later in the book. In contrast, the purple line shows the actual dependency of velocity on energy. There is a deviation in our statistical model. We can visualize this deviation as an area of uncertainty in our plot. Due to this deviation, we cannot find the perfect formula. There are different ways to show statistical deviation. In general, the deviation is related to how far the individual observations or points are from the line drawn by the model. This process is called fitting a line through points.
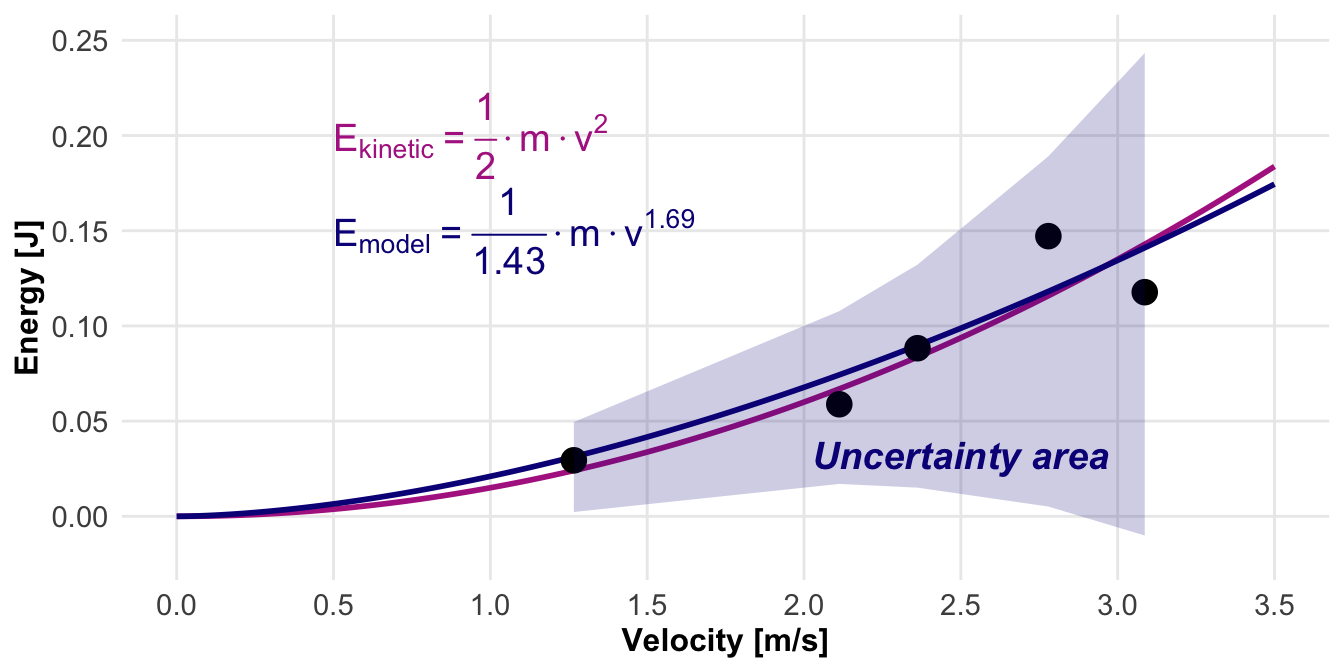
What can we learn from our small experiment? No matter what we do, there will always be an error, noise, or deviation. There are different names for nearly identical concepts. This is the core of inductive reasoning using statistics. We will always have errors, and we want to minimize them. The main topic of this book is what this error is and how we describe these errors. Not really the errors themselves, but rather the concept of drawing lines through points by minimizing error.
1.5 [Broken ideas]
Meters of books have been written about the sciences. As at the beginning stated, there are different version and definitions. While I was writing what you are now reading, I found some literature I party read and find intriguing. We meet Karl Pearson again as a founder of statistics, but in 1892 he wrote the book “The grammar of science”29, which also inspired Einstein on his way to relativity.
Can science be objective? “Science is in reality a classification and analysis of the contents of the mind. […] In truth, the field of science is much more consciousness than an external world.”
“The classification of facts, the recognition of their sequence and relative significance is the function of science, and the habit of forming a judgment upon these facts unbiased by personal feeling is characteristic of what may be termed the scientific frame of mind.” Karl
Ersnt Mach (1838-1916) “Ernst Mach’s positivism is a subjective, anti-metaphysical philosophy of science that restricts legitimate knowledge exclusively to directly observable sensations and measurements. He rejected unobservable entities like atoms as”hypothetical fictions”,”
30 What is this thing called Science?
“In the same way, it is possible to follow form and call it science, but that is pseudo-science.”
“It should not be”science has shown” but “this experiment, this effect, has shown.”
“the result of the discovery that it is worthwhile rechecking by new direct experience, and not necessarily trusting the [human] race[’s] experience from the past.”
Statistics by Fisher and quantum mechanics have in common that both do inductive probabilistic reasoning. Scientific models are deductive
Knowlegde is evolution by Deutsch and Feynman
David Deutsch claimed that science is guessing and falsification. Or in his words, “Tte whole [scientific] process resembles biological evolution. A problem is like an ecological niche, and a theory is like a gene or a species which is being tested for viability in that niche.”9
Mendel and Fisher?
We conclude the following: A hypothesis should be testable through experimentation. The experiment should be designed in such a way that the hypothesis can be rejected. We need falsification. The experiment should also be reproducible; we will come to this point later.
The measurement paradox. When there is no agent wo is measuring, does atoms exist? What does measuring mean? A interaction between a large and a small atomic object. Where is the border between large and quantum objects?
Erst Mach and observational things.
Karl Pearson what is reality.
Quantum mechanics, we do not know what reality is.
Ole Roemer (1644-1710)
https://www.amnh.org/learn-teach/curriculum-collections/cosmic-horizons-book/ole-roemer-speed-of-light
Eleven minutes (Cosmic Horizons: Astronomy at the Cutting Edge)
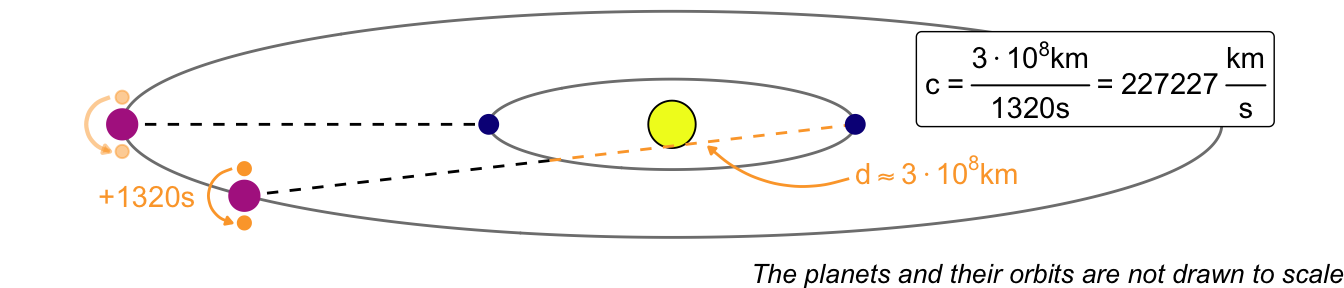
Pettenkofer vs. Koch
Definition: Beables sind Elemente der Realität, die existieren, unabhängig davon, ob sie beobachtet werden oder nicht. Unterschied zu Observablen: Während Observable Messwerte (z.B. Position oder Impuls) sind, die ein Beobachter erhält, sind Beables die grundlegenden physikalischen Fakten, aus denen die Welt besteht.
Experiment vs real world data
Clinical study vs observable study
An experiment has the randomisation included.
Why not observe something and than do science?
epistemically
observations are theory-laden
Observation = Sensory Input + Theoretical Framework
Language shapes data: We use theoretical words to describe what we see. If you say, “The electron moved,” you are already assuming the “theory” that electrons exist and are particles that move.
Or feget eveything what I have written and go with Paul Feyerabend. Paul Feyerabend’s famous dictum ‘Anything goes’ is at the heart of his methodological anarchism, which states that there are no universally valid rules in science. Feyerabend argued that progress often arises from breaking rules, which is why rigid methodology hinders rather than promotes the acquisition of knowledge.5
Age of enlightment
Romantic as the answer to enlightment.
Idea of hypotheses
34 Models Demystified: A Practical Guide from Linear Regression to Deep Learning
35 Statistical Thinking for the 21st Century
“Reality is negotiable. Outside of science and law, all rules can be bent or broken, and it doesn’t require being unethical.” — Tim Ferriss
What is a probability?
- Frequentist
- Bayes
- Propensity
1.6 Alternatives
“The truth is out there.” — The X files
Disappointed about this chapter? You wanted more but have gotten less? There are other books and ideas outside.
- Against Method: Outline of an Anarchistic Theory of Knowledge by Paul Karl Feyerabend5
- The Structure of Scientific Revolutions by Thomas S. Kuhn8
- The Logic of Scientific Discovery by critical rationalism by Karl Popper7
- The beginning of infinity: Explanations that transform the world by David Deutsch9
- An Incomplete Theory: The Search for Quantum Gravity (a Story) by Megan Henry36
1.7 Dramatis personae
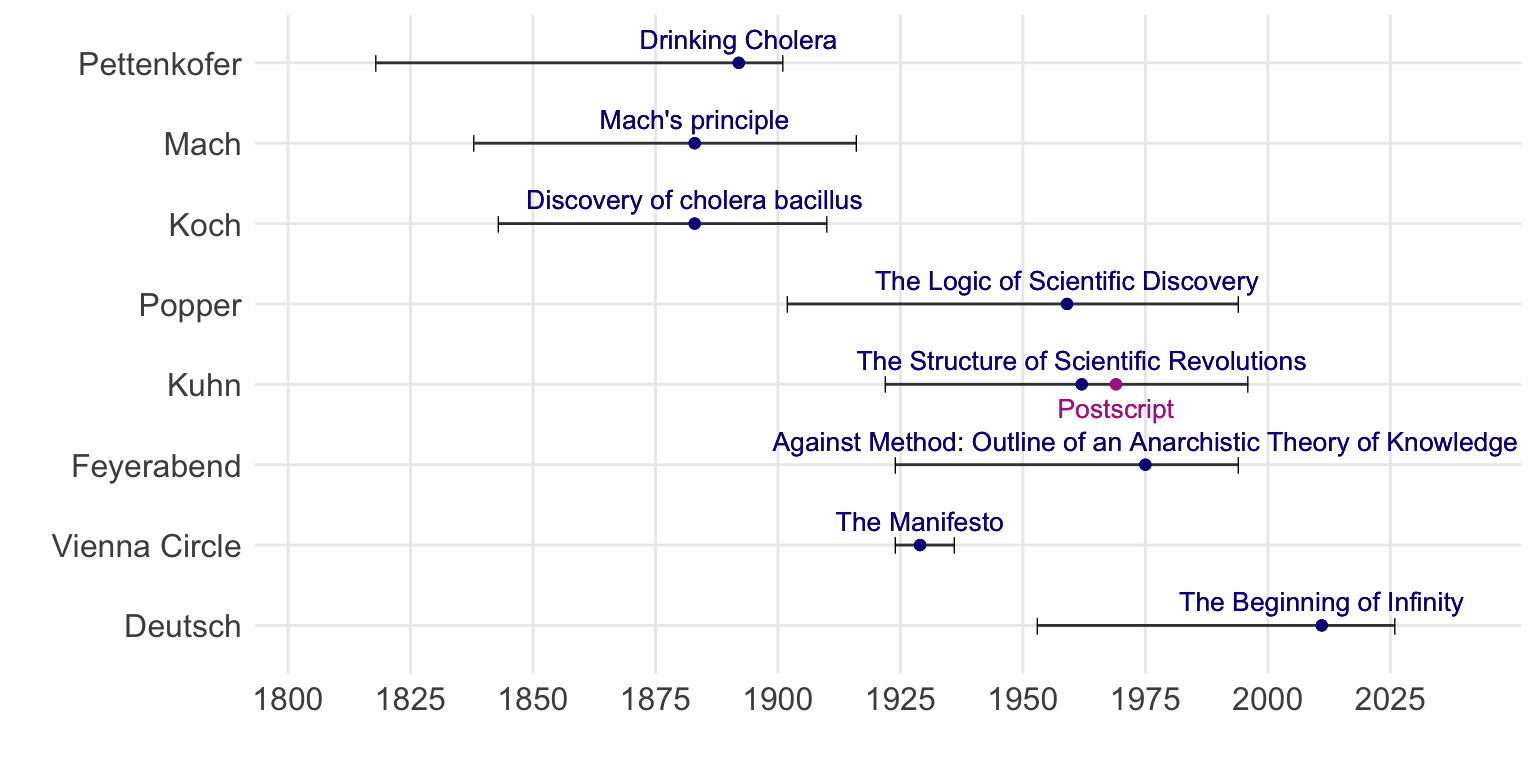
1.8 Glossary
- Experiment
-
what does it mean.
- Epistemic
-
Counterpart of aesthetic. Keep in mind the saying, “It is too beautiful (‘aesthetic’) to be true (‘epistemic’).”
- Empiricism
-
The source of knowledge comes from observation and sensory experience. We learn through the five senses, which guide our ideas. The focus is on the human mind.
- Positivism
-
The validity of knowledge comes from observation and sensory experience by ignores everything invisible or immeasurable. If you cannot measure it or observe it, it shouldn’t be part of a serious discussion.
- Logical Positivism
-
The validity of knowledge is acquired through sensory experience, by integrating modern methods of mathematics and logic. For a statement to be meaningful, it must be testable by observation. It must be proven true either by logic (an analytic statement) or by experimentation (a synthetic statement). Thus, the verification principle is introduced.
- Instrumentalism
-
foo
- Objectivism
-
foo
1.9 The meaning of “Models of Reality” in this chapter.
- Science is divided in formal and natural science
- Formal sciences provide tools for natural sciences
- Science and non-science is divided by experiment and falsification
- An experiment must include testable hypothesis
- Science is a human endeavor
- Reality exists, even if nobody is watching
- In statistics, logical positivism and instrumentalism are appealing because they provide a way to make sense of data and to make predictions.
1.10 Summary
The first chapter of this book is already the hardest. I started writing this chapter very early on, perhaps even before any of the others. Yet it took the longest to finish. The question is simple: What is science? The more I researched, the more complicated the answer became. Or the other way around. I followed the advice of Wolfgang Pauli. Pauli defined the scientific method as “taking up a subject repeatedly. Thinking about it. Setting it aside. Gathering new empirical material. And continuing this process for years if necessary. In this way, the conscious mind stimulates the unconscious mind. If anything, this is the only way to achieve results.” Therefore, I tried to read and find answers to the question of what science might be.
References
[1]
Samuel R, Thompson P. The Myths We Live by. Routledge; 2021.
[2]
Lakoff G, Johnson M. Metaphors We Live by. University of Chicago press; 2008.
[3]
Glanville R. An observing science. Foundations of Science. 2001;6(1):45-75.
[4]
Von Foerster H. On constructing a reality. In: Environmental Design Research. Routledge; 1973:35-46.
[5]
Feyerabend P. Against Method: Outline of an Anarchistic Theory of Knowledge. Verso Books; 1970.
[6]
David Mermin N. What’s wrong with this pillow? Physics Today. 1989;42(4):9-11.
[7]
Popper KR. The logic of scientific discovery. Published online 1959.
[8]
Kuhn TS, Hacking I. The Structure of Scientific Revolutions. Vol 2. University of Chicago press Chicago; 1970.
[9]
Deutsch D. The Beginning of Infinity: Explanations That Transform the World. penguin uK; 2011.
[10]
Romero F. Philosophy of science and the replicability crisis. Philosophy Compass. 2019;14(11):e12633.
[11]
Boddenberg N, King M, Stoeltzner M. The end of the theory-driven era: Five decades of particle physics. Physics in Perspective. Published online 2025:1-34.
[12]
Misiaszek M, Rossi N. Direct detection of dark matter: A critical review. Symmetry. 2024;16(2):201.
[13]
Wasserstein RL, Schirm AL, Lazar NA. Moving to a world beyond “p< 0.05.” The American Statistician. 2019;73:1-19.
[14]
Benjamin DJ, Berger JO, Johannesson M, Nosek BA, Wagenmakers EJ, Berk R, et al. Redefine statistical significance. Nature human behaviour. 2018;2(1):6-10.
[15]
Schimel J. Writing Science: How to Write Papers That Get Cited and Proposals That Get Funded. OUP USA; 2012.
[16]
Clarke AC. Clarke’s third law on UFO’s. Science. 1968;159(3812):255-255.
[17]
Feynman RP. Cargo cult science. In: The Art and Science of Analog Circuit Design. Elsevier; 1998:55-61.
[18]
Douglas KM, Sutton RM. What are conspiracy theories? A definitional approach to their correlates, consequences, and communication. Annual review of psychology. 2023;74(1):271-298.
[19]
Grimes DR. On the viability of conspiratorial beliefs. PloS one. 2016;11(1):e0147905.
[20]
Smolin L. Einstein’s Unfinished Revolution: The Search for What Lies Beyond the Quantum. Penguin; 2019.
[21]
Garisto D. The universe is not locally real, and the physics nobel prize winners proved it. Scientific American. 2022;6.
[22]
Zinsser W. Writing to Learn. Harper & Row; 1988.
[23]
Mueller PA, Oppenheimer DM. The pen is mightier than the keyboard: Advantages of longhand over laptop note taking. Psychological science. 2014;25(6):1159-1168.
[24]
Fischer EP. Die Stunde Der Physiker: Einstein, Bohr, Heisenberg Und Das Innerste Der Welt. CH Beck; 2022.
[25]
Hawkins MA. The Power of Boredom: Why Boredom Is Essential to Creating a Meaningful Life. Mark A. Hawkins; 2016.
[26]
Kruse O. Keine angst vor dem leeren blatt. Ohne Schreibblockaden durchs Studium. 2007;12:112.
[27]
Polya G. How to Solve It: A New Aspect of Mathematical Method. Princeton university press; 1945.
[28]
Fisher RA. The Design of Experiments. Oliver; Boyd; 1935.
[29]
Pearson K. The grammar of science. Nature. 1892;46(1185):247-247.
[30]
Chalmers AF. What Is This Thing Called Science? Hackett Publishing; 2013.
[31]
Feynman R. What is science. Published online 1966.
[32]
Campbell NR. What is science? Published online 1952.
[33]
Boyd NM, Bogen J. Theory and observation in science. Published online 2009.
[34]
Clark M, Berry S. Models Demystified: A Practical Guide from Linear Regression to Deep Learning. CRC Press; 2025.
[35]
Cox D, Efron B. Statistical thinking for 21st century scientists. Science advances. 2017;3(6):e1700768.
[36]
Henry M. An Incomplete Theory: The Search for Quantum Gravity (a Story). Megan Henry; 2024.