```{r echo = FALSE, warning = FALSE, message=FALSE}
source("init.R")
source("images/part_4/part_4_eda.R")
```
# Explorative data analysis {#sec-temp}
*Last modified on `r format(fs::file_info("chapter-41-eda.qmd")$modification_time, '%d. %B %Y at %H:%M:%S')`*
> *"A quote." --- Dan Meyer*
## General background
## Theoretical background
```{r}
#| message: false
#| echo: false
#| warning: false
#| fig-align: center
#| fig-height: 4
#| fig-width: 7
#| fig-cap: "foo"
#| label: fig-test-theory-dist
p_population_sample
```
```{r}
#| message: false
#| eval: false
#| echo: false
#| warning: false
#| fig-align: center
#| fig-height: 4
#| fig-width: 3
#| fig-cap: "foo"
#| label: fig-mean-dist-theo
ggplot() +
theme_book() +
coord_cartesian(xlim = c(0, 5), ylim = c(0, 60)) +
geom_point(data = jump_dog_tbl, aes(x = 0, y = jumplength), size = 2) +
geom_path(data = tibble(x_raw = seq(-15, 15, 0.1),
y_raw = dnorm(x_raw, sd = 5)),
aes(y = -(x_raw*1.4)+20, x = (y_raw*15)),
linewidth = 1, color = "black", angle = 90)
```
## R packages used
## Data
```{r}
#| message: false
#| warning: false
jump_dog_tbl <- read_delim("data/jump_fleas.txt") |>
  select(host, jumplength) |>
  filter(host == "dog")
```
```{r}
jump_dog_tbl
```
```{r}
sem <- \(x) sd(x)/sqrt(length(x))

sem(jump_dog_tbl$jumplength)
sem <- \(x) sqrt(var(x)/length(x))

sem(jump_dog_tbl$jumplength)
sem <- \(x) sqrt(sum((x-mean(x))^2)/(length(x)*(length(x)-1)))

sem(jump_dog_tbl$jumplength)
sem <- \(x) sqrt(sum((x-mean(x))^2))/sqrt(length(x)*(length(x)-1))

sem(jump_dog_tbl$jumplength)
```
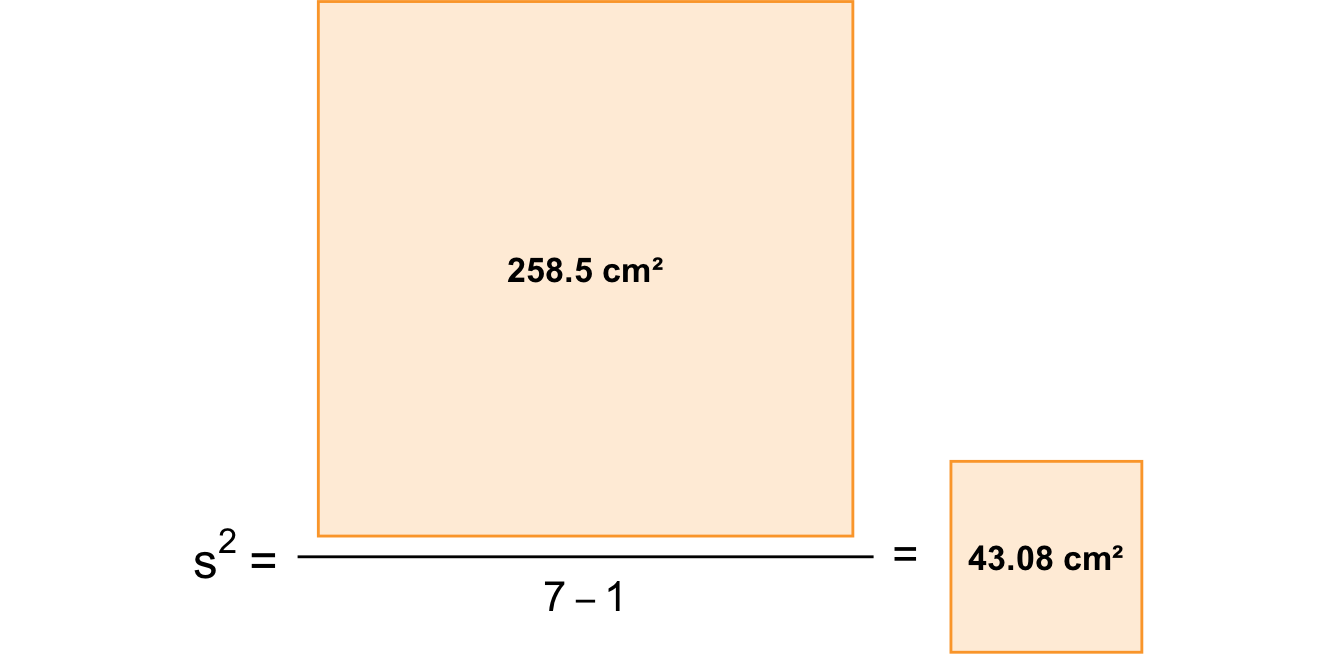
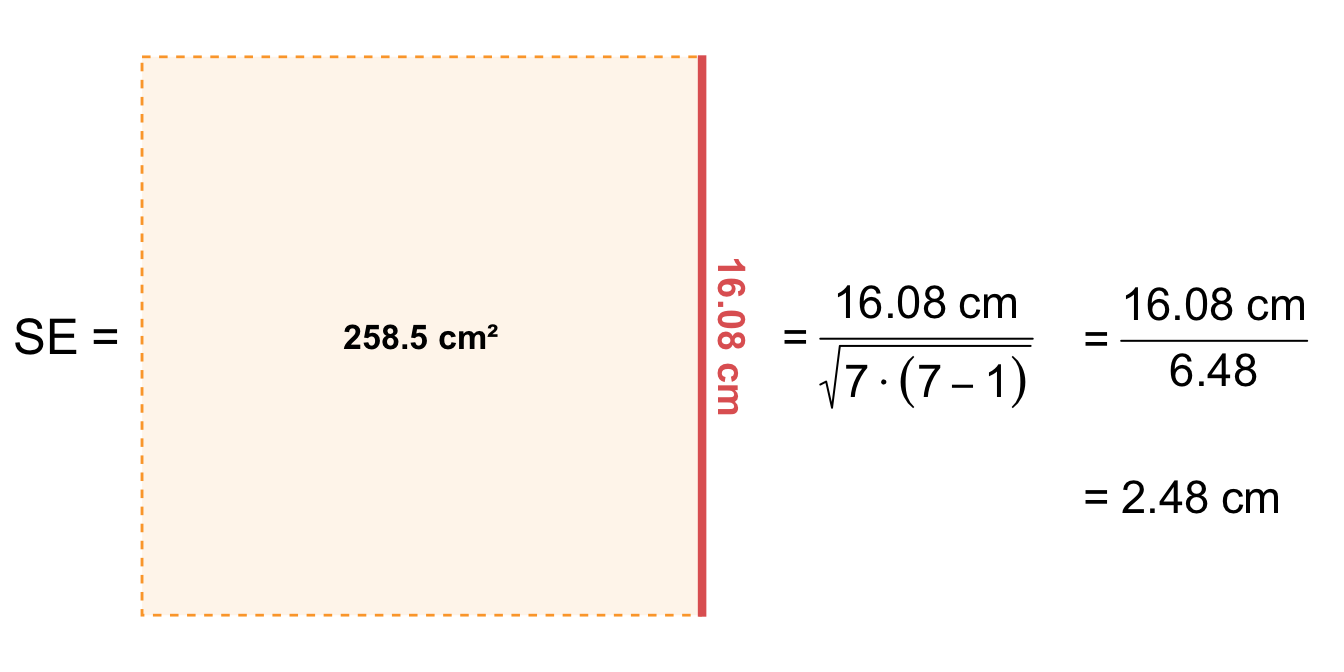
$$
SE = \cfrac{s}{\sqrt{n}}
$$
$$
SE = \sqrt{\cfrac{s^2}{n}}
$$
$$
SE = \cfrac{\sqrt{SS}}{n};\; \mbox{for large n}
$$
$$
SE = \sqrt{\cfrac{\sum_{i=1}^n\cfrac{(y_i - \bar{y})^2}{n-1}}{n}} = \sqrt{\cfrac{\sum_{i=1}^n (y_i - \bar{y})^2}{n\cdot(n-1)}} = \cfrac{\sqrt{SS}}{\sqrt{n\cdot(n-1)}}
$$
With n is large
$$
SE = \cfrac{\sqrt{\sum_{i=1}^n (y_i - \bar{y})^2}}{\sqrt{n^2}} = \cfrac{\sqrt{\sum_{i=1}^n (y_i - \bar{y})^2}}{n} = \cfrac{\sqrt{SS}}{n}
$$
```{r}
jump_dog_tbl |>
  group_by(host) |>
  summarise(mean(jumplength), var(jumplength), sd(jumplength), sem(jumplength)) |>
  mutate_if(is.numeric, round, 2)
```
```{r}
#| message: false
#| warning: false
#| echo: false
mean_dog_jump <- mean(jump_dog_tbl$jumplength)
jump_dog_plot_tbl <- jump_dog_tbl |>
mutate(e = jumplength - mean_dog_jump,
sign = as_factor(ifelse(sign(e) == -1, "\U2012", "+")))
sum_e_dog_jump <- sum(abs(jump_dog_plot_tbl$e))
```
## Mean
```{r}
#| message: false
#| echo: false
#| warning: false
#| fig-align: center
#| fig-height: 4
#| fig-width: 7
#| fig-cap: "foo"
#| label: fig-mean-dist
mean_dog_jump <- mean(jump_dog_tbl$jumplength)
sd_dog_jump <- sd(jump_dog_tbl$jumplength)
p1_fig_dist_example <- ggplot() +
theme_book() +
coord_cartesian(xlim = c(-0.25, 0.25), ylim = c(0, 60)) +
geom_point(data = jump_dog_tbl, aes(x = 0, y = jumplength), size = 2) +
geom_text_repel(data = jump_dog_tbl, aes(x = 0, y = jumplength, label = 1:7)) +
scale_x_continuous(breaks = 0, labels = "dog") +
scale_y_continuous(breaks = c(0, 20, mean_dog_jump, 40, 60),
labels = c("0", "20", round(mean_dog_jump,1), "40", "60")) +
labs(x = "", y = "Jump length in [cm]")
p3_fig_dist_example <- ggplot() +
theme_book() +
coord_cartesian(xlim = c(0, 1.4), ylim = c(0, 60)) +
geom_rect(aes(xmin = 0.4, xmax = 1.1, ymin = 0, ymax = mean_dog_jump), fill = "#B12A9080",
color = "black") +
geom_segment(aes(x = 0.75, xend = 0.75,
y = mean_dog_jump, yend = mean_dog_jump+ sd_dog_jump),
color = "#E16462FF", size = 1) +
geom_segment(aes(x = 0.6, xend = 0.9,
y = mean_dog_jump+ sd_dog_jump, yend = mean_dog_jump+ sd_dog_jump),
color = "#E16462FF", size = 1) +
scale_x_continuous(breaks = 0.75, labels = "dog") +
scale_y_continuous(breaks = c(0, 20, mean_dog_jump, 40, 60),
labels = c("0", "20", round(mean_dog_jump,1), "40", "60")) +
labs(x = "Flea host", y = "")
p2_fig_dist_example <- ggplot() +
theme_book() +
coord_cartesian(xlim = c(-0.25, 1.5), ylim = c(0, 60)) +
geom_point(data = jump_dog_tbl, aes(x = 0, y = jumplength), size = 2) +
geom_segment(aes(x = 0.75, xend = 0.75,
y = mean_dog_jump, yend = mean_dog_jump+ sd_dog_jump),
color = "#E16462FF", size = 1) +
annotate("text", x = 0.8, y = mean_dog_jump+ sd_dog_jump/2-0.5, hjust = "left",
label = expression(bold(s)), size = 5, color = "#E16462FF") +
geom_path(data = tibble(x_raw = seq(mean_dog_jump-mean_dog_jump/1.5,
mean_dog_jump+mean_dog_jump/1.5, 0.1),
y_raw = dnorm(x_raw, mean = mean_dog_jump, sd = sd_dog_jump)),
aes(y = x_raw, x = y_raw*20),
linewidth = 1, color = "black", angle = 90) +
geom_segment(aes(x = -0.03, xend = 1.35,
y = mean_dog_jump, yend = mean_dog_jump), color = "#B12A90FF", size = 1) +
annotate("text", x = 1.4, y = 33, hjust = "left", label = expression(bold(bar(y))),
size = 5, color = "#B12A90FF") +
geom_text_repel(data = jump_dog_tbl, aes(x = 0, y = jumplength, label = 1:7)) +
scale_x_continuous(breaks = 0, labels = "dog") +
scale_y_continuous(breaks = c(0, 20, mean_dog_jump, 40, 60),
labels = c("0", "20", round(mean_dog_jump,1), "40", "60")) +
labs(x = "", y = "")
p1_fig_dist_example + p3_fig_dist_example + p2_fig_dist_example +
plot_layout(ncol = 3, widths = c(1, 1, 2.5)) +
plot_annotation(tag_levels = 'A', tag_prefix = '(', tag_suffix = ')') &
theme(plot.tag = element_text(size = 16, face = "bold"))
```
```{r}
#| message: false
#| echo: false
#| warning: false
#| fig-align: center
#| fig-height: 4.5
#| fig-width: 8
#| fig-cap: "foo"
#| label: fig-mean-example
mean_dog_jump <- mean(jump_dog_tbl$jumplength)
sd_dog_jump <- sd(jump_dog_tbl$jumplength)
jump_dog_plot_tbl <- jump_dog_tbl |>
mutate(e = round(jumplength - mean_dog_jump, 1),
sign = as_factor(ifelse(sign(e) == -1, "\U2012", "+")),
e_label = str_c(sign, abs(e)))
p1_fig_mean_example <- jump_dog_plot_tbl |>
ggplot(aes(x = 1:7, y = jumplength)) +
theme_book() +
geom_segment(aes(x = 1:7, xend = 1:7, y = jumplength, yend = mean_dog_jump,
color = sign), show.legend = FALSE, size = 1) +
geom_text(aes(x = 1:7, y = jumplength - e/2, label = e_label, color = sign),
size = 4, position = position_nudge(0.3), fontface = 2, show.legend = FALSE) +
geom_hline(yintercept = mean_dog_jump, color = "#B12A90FF", size = 1) +
geom_point(size = 2) +
scale_x_continuous(breaks = c(0:7), labels = c("All", 1:7)) +
scale_y_continuous(breaks = c(25, 30, mean_dog_jump, 35, 40),
labels = c("25", "30", round(mean_dog_jump,1), "35", "40"),
limits = c(19, 44)) +
labs(x = "Dog flea ID", y = "") +
scale_color_viridis(discrete = TRUE, option = "plasma", end = 0.9) +
geom_shape(data = tibble(x = c(4.6, 5.6, 5.6, 4.6),
y = c(19, 19, 28.5, 28.5)),
aes(x, y), radius = unit(0.2, 'cm'), fill = "gray95") +
geom_shape(data = tibble(x = c(5.8, 7.1, 7.1, 5.8),
y = c(19, 19, 28.5, 28.5)),
aes(x, y), radius = unit(0.2, 'cm'), fill = "gray95") +
annotate("label", x = 5.1, y = 29, label = "Negative", fontface = 2,
fill = "#0D0887FF", alpha = 0.5) +
annotate("label", x = 6.45, y = 29, label = "Positive", fontface = 2,
fill = "#FCCE25FF", alpha = 0.5) +
geom_segment(data = filter(jump_dog_plot_tbl, sign == "\U2012"),
aes(x = 4.8 + c(0, 0.3, 0.6), xend = 4.8 + c(0, 0.3, 0.6),
y = (jumplength+20)/2, yend = (mean_dog_jump+20)/2,
color = sign), show.legend = FALSE, size = 1) +
geom_segment(data = filter(jump_dog_plot_tbl, sign == "+"),
aes(x = 6 + c(0, 0.3, 0.6, 0.9), xend = 6 + c(0, 0.3, 0.6, 0.9),
y = (jumplength+13)/2, yend = (mean_dog_jump+13)/2,
color = sign), show.legend = FALSE, size = 1) +
geom_text(data = filter(jump_dog_plot_tbl, sign == "\U2012"),
aes(x = 4.8 + c(0, 0.3, 0.6), y = (jumplength+20)/2-0.5,
label = e_label, color = sign), fontface = 2, show.legend = FALSE, size = 3) +
geom_text(data = filter(jump_dog_plot_tbl, sign == "+"),
aes(x = 6 + c(0, 0.3, 0.6, 0.9), y = (jumplength+13)/2+0.5,
label = e_label, color = sign), fontface = 2, show.legend = FALSE, size = 3) +
annotate("text", x = 5.7, y = 24, label = "=", size = 6) +
annotate("text", x = 5.3, y = 20, label = expression(sum()*-17.4), size = 3) +
annotate("text", x = 6.8, y = 20, label = expression(sum()*+17.4), size = 3) +
theme(axis.text.y = element_blank())
p1_fig_dist_example +
coord_cartesian(xlim = c(-0.25, 0.25), ylim = c(19, 44)) +
geom_hline(yintercept = mean_dog_jump, color = "#B12A90FF", size = 1) +
scale_y_continuous(breaks = c(25, 30, mean_dog_jump, 35, 40),
labels = c("25", "30", round(mean_dog_jump,1), "35", "40"),
limits = c(19, 44)) +
p1_fig_mean_example +
plot_layout(ncol = 2, widths = c(1, 10)) +
plot_annotation(tag_levels = 'A', tag_prefix = '(', tag_suffix = ')') &
theme(plot.tag = element_text(size = 16, face = "bold"))
```
```{r}
#| message: false
#| echo: false
#| warning: false
#| fig-align: center
#| fig-height: 4.5
#| fig-width: 7.5
#| fig-cap: "foo"
#| label: fig-var-2-example
mean_dog_jump <- mean(jump_dog_tbl$jumplength)
sum_e_dog_jump <- sum(abs(jump_dog_plot_tbl$e))
jump_dog_plot_tbl |>
ggplot(aes(x = 1:7, y = jumplength)) +
theme_book() +
coord_equal() +
annotate("segment", x = rep(-2, 6), xend = rep(14, 6),
y = c(15, 20, 25, 30, 35, 40), yend = c(15, 20, 25, 30, 35, 40),
color = "gray95") +
geom_vline(xintercept = 1:7, color = "gray95") +
geom_tile(aes(x = 1:7 - e/2,
y = jumplength - e/2,
width = e, height = e), fill = "#FCA63680",
alpha = 0.2, color = "#FCA636FF", linewidth = 0.5) +
geom_shape(data = tibble(x = c(13.8, 46.5, 46.5, 13.8) + 7,
y = c(33, 33, 47, 47) - 4),
aes(x, y), radius = unit(0.2, 'cm'), fill = "gray95") +
geom_tile(aes(x = c(20, 28.4, 28.4, 31.5, 34, 35, 41.6)+7,
y = c(40, 36.7, 42, 42, 37.2, 42, 38.5)-4,
width = e, height = e), fill = "#FCA63680",
alpha = 0.2, color = "#FCA636FF", linewidth = 0.5) +
geom_text(aes(x = c(20, 28.4, 28.4, 31.5, 34, 35, 41.6)+7,
y = c(40, 36.7, 42, 42, 37.2, 42, 38.5)-4, label = round(e^2,1)),
fontface = 2) +
annotate("text", x = 50, y = 40.5, label = expression(sum()*258.5), size = 5) +
annotate("tile", x = 28.25, y = 20,
width = sum_e_dog_jump/2.5, height = sum_e_dog_jump/2.5, fill = "#FCA63680",
alpha = 0.2, color = "#FCA636FF", linewidth = 0.5) +
annotate("text", x = 28.25, y = 20, label = "258.5 cm²", fontface = 2, size = 4.5) +
geom_segment(x = -2, xend = 13,
y = mean_dog_jump, yend = mean_dog_jump, color = "#B12A90FF", size = 1) +
annotate("text", x = 13.5, y = 33, hjust = "left", label = expression(bold(bar(y))),
size = 5, color = "#B12A90FF") +
geom_point() +
scale_x_continuous(breaks = 1:7, limits = c(NA, 54),
expand = expand_scale(mult = 0)) +
scale_y_continuous(breaks = c(15, 20, 25, 30, mean_dog_jump, 35, 40),
labels = c("15", "20", "25", "30", round(mean_dog_jump,1), "35", "40"),
limits = c(NA, NA)) +
labs(x = str_pad("Dog flea ID", 122.5, "right"), y = "Jump length in [cm]") +
scale_color_viridis(discrete = TRUE, option = "plasma", end = 0.9) +
annotate("text", x = 20.5, y = 36, hjust = "right", label = expression(SS~"="),
size = 5) +
annotate("text", x = 20.5, y = 20, hjust = "right", label = expression(SS~"="),
size = 5) +
theme(panel.grid = element_blank())
```
```{r}
#| message: false
#| echo: false
#| warning: false
#| fig-align: center
#| fig-height: 3.5
#| fig-width: 7
#| fig-cap: "foo"
#| label: fig-var-3-example
ggplot() +
theme_void() +
coord_equal() +
scale_x_continuous(breaks = -10:10, expand = expansion(mult = 0), limits = c(-8.5, 17)) +
scale_y_continuous(breaks = -10:15, expand = expansion(mult = 0), limits = c(-5.5, 12)) +
annotate("tile", x = 2, y = 5,
width = sum_e_dog_jump/2.5, height = sum_e_dog_jump/2.5, fill = "#FCA63680",
alpha = 0.2, color = "#FCA636FF", linewidth = 0.5) +
annotate("text", x = 2, y = 5, label = "258.5 cm²", fontface = 2, size = 4.5) +
annotate("text", x = -6, y = -2.4, hjust = "right", label = expression(s^2~"="),
size = 6.5) +
annotate("segment", x = -5.5, xend = 9.5, y = -2.5, yend = -2.5) +
annotate("text", x = 2, y = -3.5, label = expression(7-1), fontface = 1, size = 5.5) +
annotate("text", x = 10, y = -2.4, hjust = "left", label = expression("="),
size = 6) +
annotate("tile", x = 14, y = -2.5,
width = sum_e_dog_jump/7, height = sum_e_dog_jump/7, fill = "#FCA63680",
alpha = 0.2, color = "#FCA636FF", linewidth = 0.5) +
annotate("text", x = 14, y = -2.5, label = "43.08 cm²", fontface = 2, size = 4.5)
```
```{r}
#| message: false
#| echo: false
#| warning: false
#| fig-align: center
#| fig-height: 1.75
#| fig-width: 7
#| fig-cap: "foo"
#| label: fig-var-4-example
ggplot() +
theme_void() +
coord_equal() +
scale_x_continuous(breaks = -10:10, expand = expansion(mult = 0), limits = c(-7.5, 3.5)) +
scale_y_continuous(breaks = -10:15, expand = expansion(mult = 0), limits = c(-5, 0)) +
annotate("text", x = -5.75, y = -2.6, hjust = "right", label = expression(s~"="),
size = 6.5) +
annotate("tile", x = -3, y = -2.5,
width = sum_e_dog_jump/7, height = sum_e_dog_jump/7, fill = "#FCA63680",
alpha = 0.1, color = "#FCA636FF", linewidth = 0.5, linetype = "33") +
annotate("segment", x = -0.5, xend = -0.5, y = -5, yend = 0, size = 1.5, color = "#E16462FF") +
annotate("text", x = 0, y = -2.5, hjust = "center", label = "6.56 cm", color = "#E16462FF",
fontface = 2, angle = -90, size = 5) +
annotate("text", x = -3, y = -2.5, label = "43.08 cm²", fontface = 2, size = 4.5) +
annotate("text", x = 0.5, y = -2.6, hjust = "left", label = expression("="~"6.56 cm"),
size = 6)
```
```{r}
#| message: false
#| echo: false
#| warning: false
#| fig-align: center
#| fig-height: 3.5
#| fig-width: 7
#| fig-cap: "foo"
#| label: fig-var-5-example
ggplot() +
theme_void() +
coord_equal() +
scale_x_continuous(breaks = -10:20, expand = expansion(mult = 0), limits = c(-8.5, 25)) +
scale_y_continuous(breaks = -10:15, expand = expansion(mult = 0), limits = c(-2, 12)) +
annotate("text", x = -5.5, y = 5, hjust = "right", label = expression(SE~"="),
size = 6.5) +
annotate("tile", x = 2, y = 5,
width = sum_e_dog_jump/2.5, height = sum_e_dog_jump/2.5, fill = "#FCA63680",
alpha = 0.1, color = "#FCA636FF", linewidth = 0.5, linetype = "33") +
annotate("text", x = 2, y = 5, label = "258.5 cm²", fontface = 2, size = 4.5) +
annotate("segment", x = 9, xend = 9, y = -2, yend = 12, size = 1.5, color = "#E16462FF") +
annotate("text", x = 9.75, y = 5, hjust = "center", label = "16.08 cm", color = "#E16462FF",
fontface = 2, angle = -90, size = 5) +
annotate("text", x = -3, y = -2.5, label = "43.08 cm²", fontface = 2, size = 4.5) +
annotate("text", x = 11, y = 4.75, hjust = "left",
label = expression("="~frac(16.08~"cm", sqrt(7 %.% (7-1)))),
color = "black", size = 6) +
annotate("text", x = 18.5, y = 5, hjust = "left",
label = expression("="~frac(16.08~"cm", 6.48)),
color = "black", size = 6) +
annotate("text", x = 18.5, y = 1, hjust = "left",
label = expression("="~2.48~"cm"),
color = "black", size = 6)
```
```{r}
#| message: false
#| echo: false
#| warning: false
#| fig-align: center
#| fig-height: 4.75
#| fig-width: 5
#| fig-cap: "foo"
#| label: fig-var-6-example
sd_forumla_x <- -5.5
sd_tile_x <- -3
se_forumla_x <- 5.5
se_tile_x <- 3
ggplot() +
theme_void() +
coord_equal() +
scale_x_continuous(breaks = -15:15, expand = expansion(mult = 0), limits = c(-8, 8)) +
scale_y_continuous(breaks = 0:-15, expand = expansion(mult = 0), limits = c(1, -14.5)) +
annotate("text", x = c(-4, 4), y = c(0.5, 0.5), label = c("Standard deviation", "Standard error"),
fontface = 2, size = 5) +
annotate("segment", x = 0, xend = 0, y = 1, yend = -14.5, color = "gray50") +
annotate("tile", x = c(sd_tile_x, se_tile_x), y = c(-2, -2),
width = 3, height = 3, fill = "#FCA63680",
alpha = 0.2, color = "#FCA636FF", linewidth = 0.5) +
annotate("tile", x = c(sd_tile_x), y = c(-8),
width = 1.5, height = 1.5, fill = "#FCA63680",
alpha = 0.2, color = "#FCA636FF", linewidth = 0.5) +
annotate("tile", x = c(se_tile_x), y = c(-8),
width = 3, height = 3, fill = "#FCA63680",
alpha = 0.1, color = "#FCA636FF", linewidth = 0.5, linetype = "33") +
annotate("tile", x = c(sd_tile_x), y = -13.25,
width = 1.5, height = 1.5, fill = "#FCA63680",
alpha = 0.1, color = "#FCA636FF", linewidth = 0.5, linetype = "33") +
annotate("segment", x = sd_tile_x+0.75, xend = sd_tile_x+0.75, y = -12.5, yend = -14,
size = 1.5, color = "#E16462FF") +
annotate("segment", x = se_tile_x+1.5, xend = se_tile_x+1.5, y = -9.5, yend = -6.5,
size = 1.5, color = "#E16462FF") +
annotate("segment", x = se_tile_x, xend = se_tile_x, y = -12.75, yend = -13.75,
size = 1.5, color = "#E16462FF") +
geom_curve(aes(x = sd_tile_x, y = -4, xend = sd_tile_x, yend = -6.75),
arrow = arrow(length = unit(0.02, "npc"), type = "closed"),
curvature = 0, color = "black", lineend = "round") +
geom_curve(aes(x = sd_tile_x, y = -9.25, xend = sd_tile_x, yend = -12),
arrow = arrow(length = unit(0.02, "npc"), type = "closed"),
curvature = 0, color = "black", lineend = "round") +
geom_curve(aes(x = se_tile_x, y = -4, xend = se_tile_x, yend = -6),
arrow = arrow(length = unit(0.02, "npc"), type = "closed"),
curvature = 0, color = "black", lineend = "round") +
geom_curve(aes(x = se_tile_x, y = -10, xend = se_tile_x, yend = -12.25),
arrow = arrow(length = unit(0.02, "npc"), type = "closed"),
curvature = 0, color = "black", lineend = "round") +
annotate("label", hjust = "right", x = sd_tile_x - 0.5, y = -5.25,
label = "divide by n", fontface = 3, color = "#0D0887FF") +
annotate("label", hjust = "right", x = sd_tile_x - 0.5, y = -10.5,
label = "square root", fontface = 3, color = "#B12A90FF") +
annotate("label", hjust = "left", x = se_tile_x + 0.5, y = -4.875,
label = "square root", fontface = 3, color = "#B12A90FF") +
annotate("label", hjust = "left", x = se_tile_x + 0.5, y = -11,
label = "divide by n", fontface = 3, color = "#0D0887FF") +
annotate("text", hjust = "center", x = sd_forumla_x, y = -2,
label = expression(SS)) +
annotate("text", hjust = "center", x = sd_forumla_x, y = -8,
label = expression(frac(SS, n)), color = "#0D0887FF") +
annotate("text", hjust = "center", x = sd_forumla_x, y = -13.25,
label = expression(sqrt(frac(SS, n))), color = "#B12A90FF") +
annotate("text", hjust = "center", x = se_forumla_x, y = -2,
label = expression(SS)) +
annotate("text", hjust = "center", x = se_forumla_x, y = -8,
label = expression(sqrt(SS)), color = "#B12A90FF") +
annotate("text", hjust = "center", x = se_forumla_x, y = -13.25,
label = expression(frac(sqrt(SS), n)), color = "#0D0887FF") +
annotate("text", c(sd_tile_x, se_tile_x), y = c(-2, -2), label = c(258.5), fontface = 2) +
annotate("text", c(sd_tile_x, se_tile_x+1.125), y = c(-8, -8), label = c(43.08, 16.08), fontface = 2,
angle = c(0, 90), color = c("black", "#E16462FF")) +
annotate("text", c(sd_tile_x+0.375, se_tile_x-0.375), y = c(-13.25, -13.25),
label = c(6.56, 2.48), fontface = 2,
angle = 90, color = "#E16462FF")
```
## Alternatives
Further tutorials and R packages on XXX
## Glossary
term
: what does it mean.
## The meaning of "Models of Reality" in this chapter.
- itemize with max. 5-6 words
## Summary
## References {.unnumbered}