```{r echo = FALSE, warning = FALSE, message = FALSE}
source("init.R")
source("images/part_1/part_1_data.R")
```
# Blood meal of fleas {#sec-temp}
*Last modified on `r format(fs::file_info("chapter-11-covariate-data.qmd")$modification_time, '%d. %B %Y at %H:%M:%S')`*
> *"A quote." --- Dan Meyer*
## General background
## Theoretical background
## R packages used
## Data
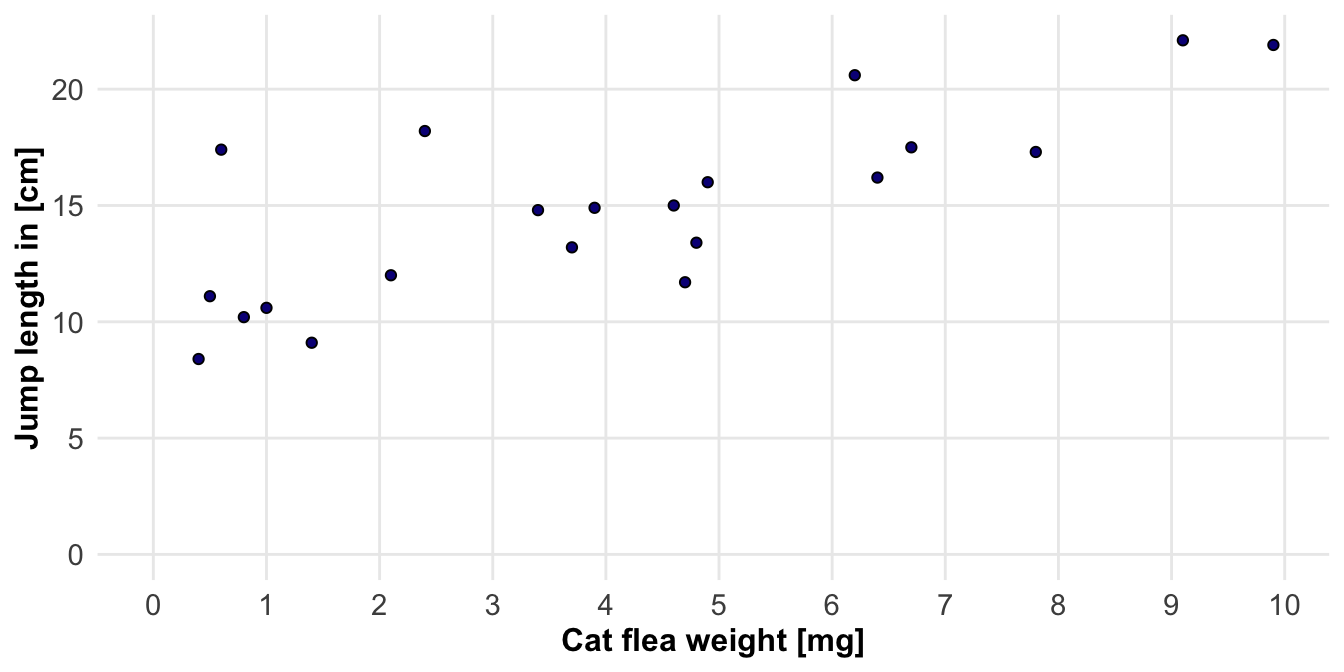
### Linear
```{r}
jump_weight_tbl <- tibble(x = abs(rnorm(21, 3, 4)),
                          y = 10 + 1.2 * x + rnorm(21, 0, 2)) |>
  mutate_all(round, 1) |>
  rename(weight = x, jumplength = y)
```
```{r}
#| echo: false
#| message: false
#| warning: false
#| label: fig-chap-11-cov-01
#| fig-align: center
#| fig-height: 3.5
#| fig-width: 7
#| fig-cap: "foo **(A)** foo **(B)** foo"
jump_weight_tbl |>
ggplot(aes(x = weight, y = jumplength, fill = col_pal(1, 0.5))) +
theme_book() +
geom_point(show.legend = FALSE, shape = 21) +
labs(x = "Body weight [mg]", y = "Jump length in [cm]",
fill = "Host") +
scale_fill_viridis(discrete = TRUE, option = "plasma") +
scale_x_continuous(breaks = 0:10) +
coord_cartesian(xlim = c(0, NA), ylim = c(0, NA))
```
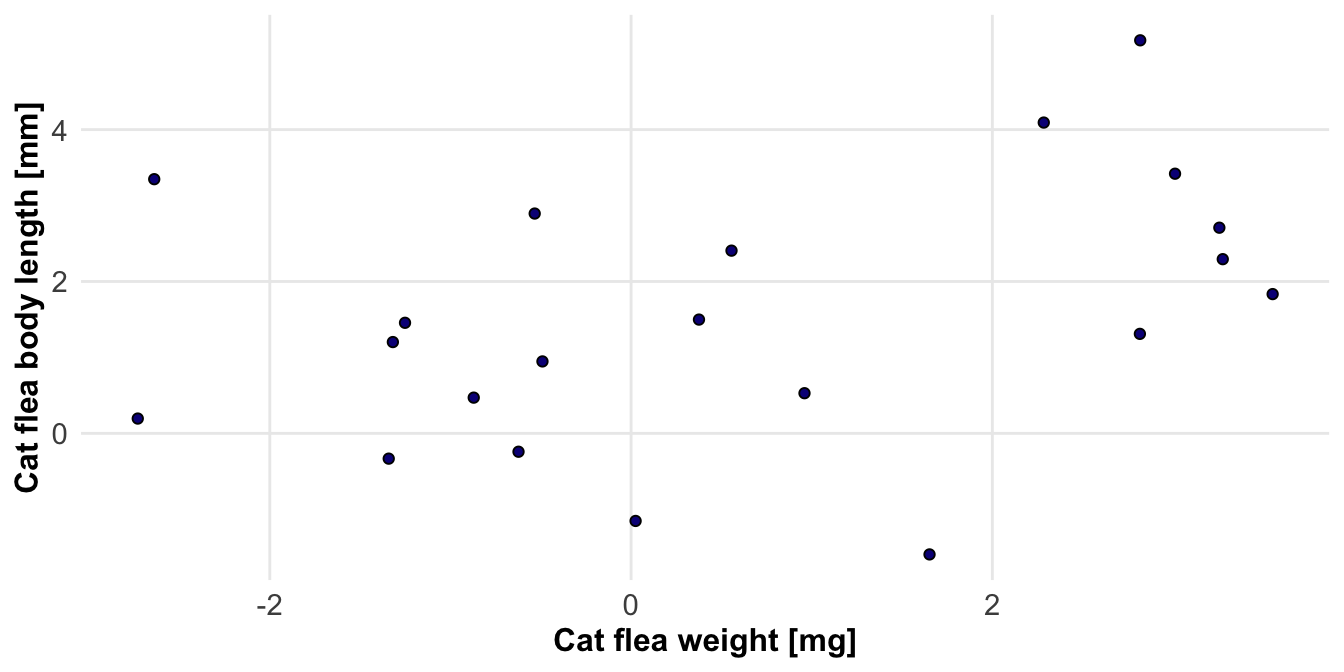
```{r}
library(mvtnorm)

sigma <- matrix(c(4,2,2,3), ncol=2)
x <- rmvnorm(n = 21, mean=c(1,2), sigma=sigma) |>
  as_tibble() |>
  rename(weight = V1, bodylength = V2)
colMeans(x)
var(x)
```
```{r}
#| echo: false
#| message: false
#| warning: false
#| label: fig-chap-11-cov-02
#| fig-align: center
#| fig-height: 3.5
#| fig-width: 7
#| fig-cap: "foo **(A)** foo **(B)** foo"
x |>
ggplot(aes(x = weight, y = bodylength, fill = col_pal(1, 0.5))) +
theme_book() +
geom_point(show.legend = FALSE, shape = 21) +
labs(x = "Body weight [mg]", y = "Body length [mm]",
fill = "Host") +
scale_fill_viridis(discrete = TRUE, option = "plasma") #+
# scale_x_continuous(breaks = 0:10) +
# coord_cartesian(xlim = c(0, NA), ylim = c(0, NA))
```
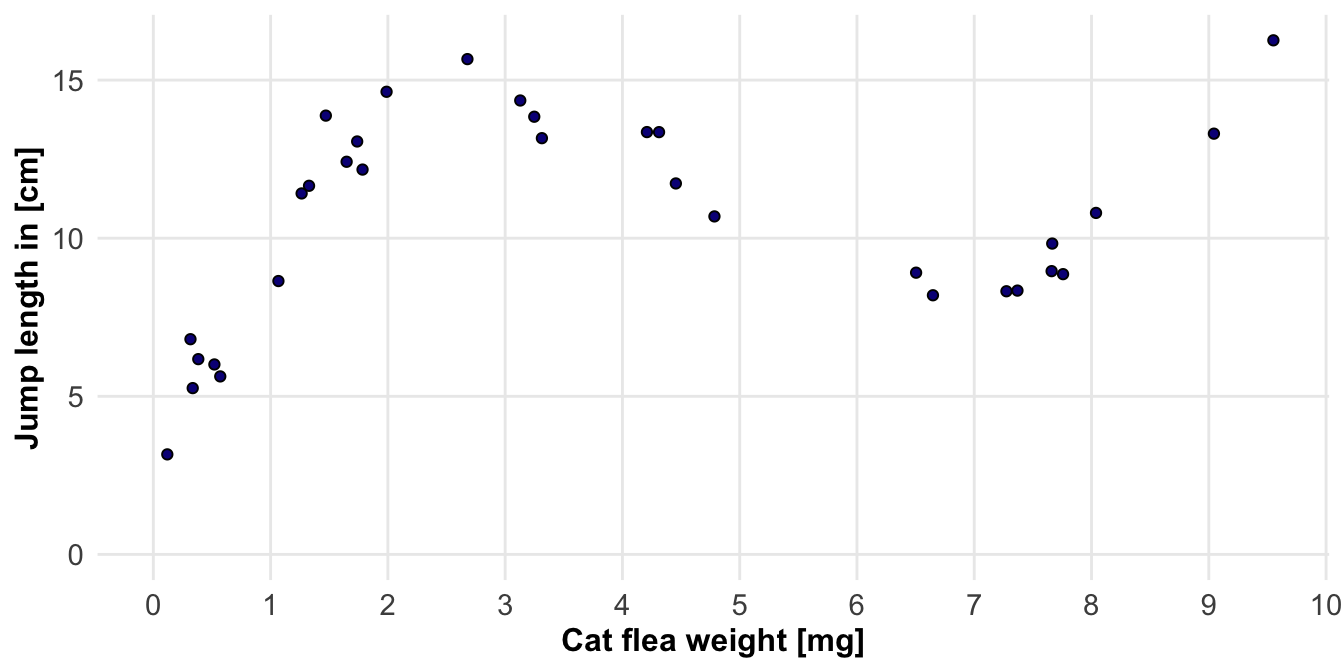
### Non-linear
```{r}
jump_weight_non_linear_tbl <- tibble(x = abs(rnorm(32, 3, 4)),
                                     y = 0.15*x^3 - 2.2*x^2 + 8.8*x + 3.2 + rnorm(32, 0, 1)) |>
  rename(weight = x, jumplength = y)
```
```{r}
#| echo: false
#| message: false
#| warning: false
#| label: fig-chap-11-cov-04
#| fig-align: center
#| fig-height: 3.5
#| fig-width: 7
#| fig-cap: "foo **(A)** foo **(B)** foo"
jump_weight_non_linear_tbl |>
ggplot(aes(x = weight, y = jumplength, fill = col_pal(1, 0.5))) +
theme_book() +
geom_point(show.legend = FALSE, shape = 21) +
labs(x = "Body weight [mg]", y = "Jump length in [cm]",
fill = "Host") +
scale_fill_viridis(discrete = TRUE, option = "plasma") +
scale_x_continuous(breaks = 0:10) +
coord_cartesian(xlim = c(0, NA), ylim = c(0, NA))
```
## Data availability
The data is available as txt-Files under <https://github.com/jkruppa/biodatascience>.
```{r}
#| echo: false
jump_weight_tbl |>
mutate_if(is.numeric, round, 2) |>
write_delim("data/jump_weight.txt")
jump_weight_non_linear_tbl |>
mutate_if(is.numeric, round, 2) |>
write_delim("data/jump_weight_non_linear.txt")
```
## Alternatives
Further tutorials and R packages on XXX
## Glossary
term
: what does it mean.
## The meaning of "Models of Reality" in this chapter.
- itemize with max. 5-6 words
## Summary
## References {.unnumbered}