8 Statistical testing
Last modified on 03. January 2026 at 20:13:29
“A quote.” — Dan Meyer
8.1 General background
8.2 Theoretical background
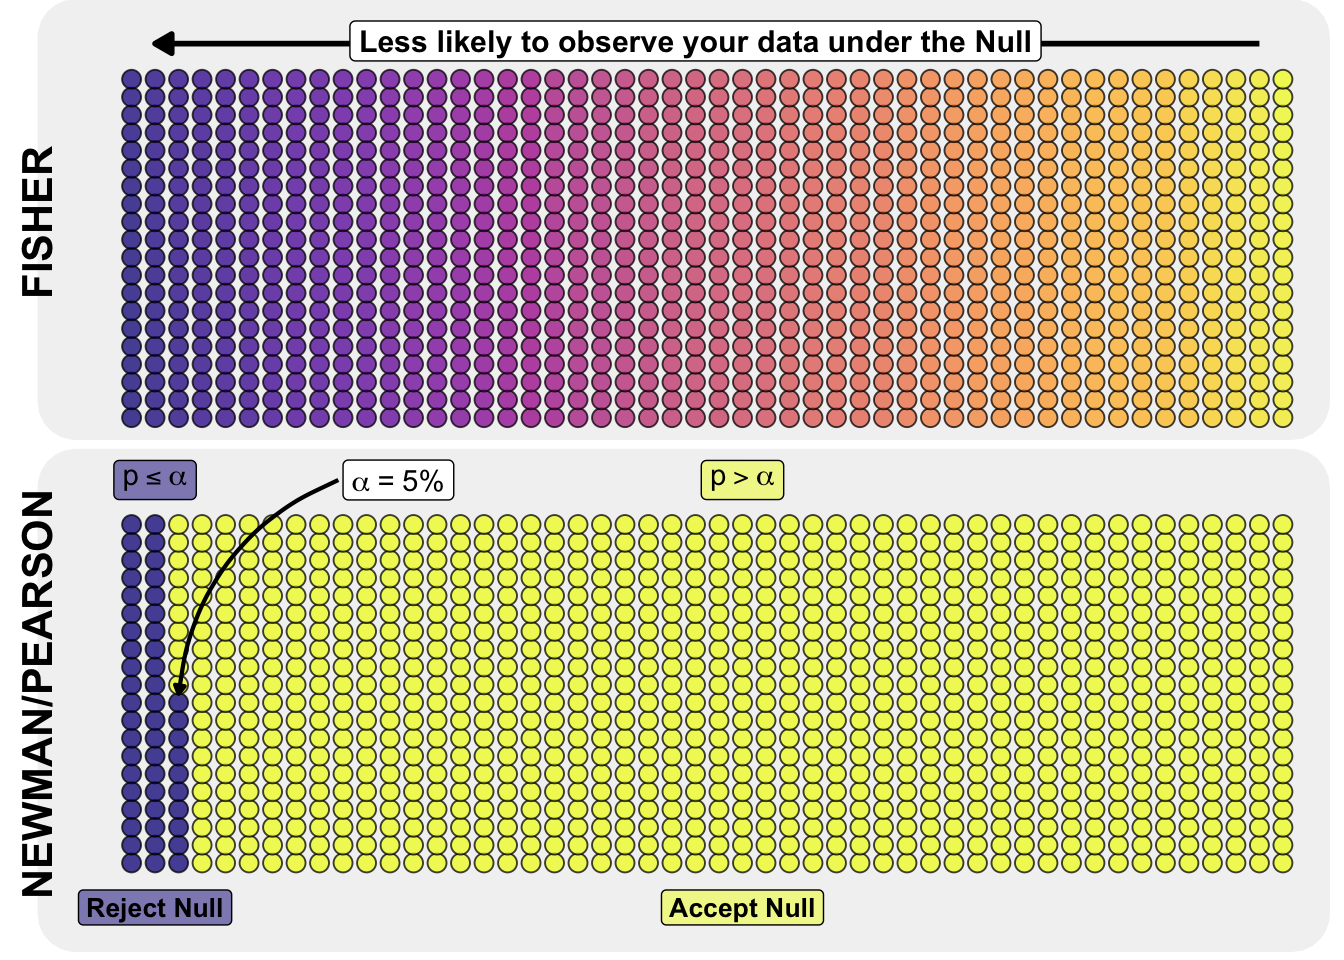
8.2.1 Fisher’s approach: The ‘significance test’
Fisher saw statistics as a tool for inductive reasoning (learning from data for science).
- Only ONE hypothesis: There is only the null hypothesis (\(H_0\) e.g., ‘no effect’). An alternative does not formally exist.
- The measure (p-value): The p-value is a continuous measure of the strength of evidence against the null hypothesis \(H_0\).
- \(p = 0.01\) Strong evidence against the null hypothesis.
- \(p = 0.20\) No evidence against the null hypothesis.
- The result: One rejects the null hypothesis \(H_0\) or one does not make a judgement. One never ‘accepts’ the null hypothesis (one simply has not found enough evidence to reject it).
- Objective: Gain knowledge through individual experiments.
8.2.2 Neyman-Pearson’s approach: The ‘hypothesis test’
Neyman and Pearson sharply criticised Fisher. They said, ‘You can’t reject anything if you don’t know what to accept instead.’ They saw statistics as a decision-making process (behaviourism).
- TWO hypotheses: There is the null hypothesis (\(H_0\)) AND a specific alternative hypothesis (\(H_A\)).
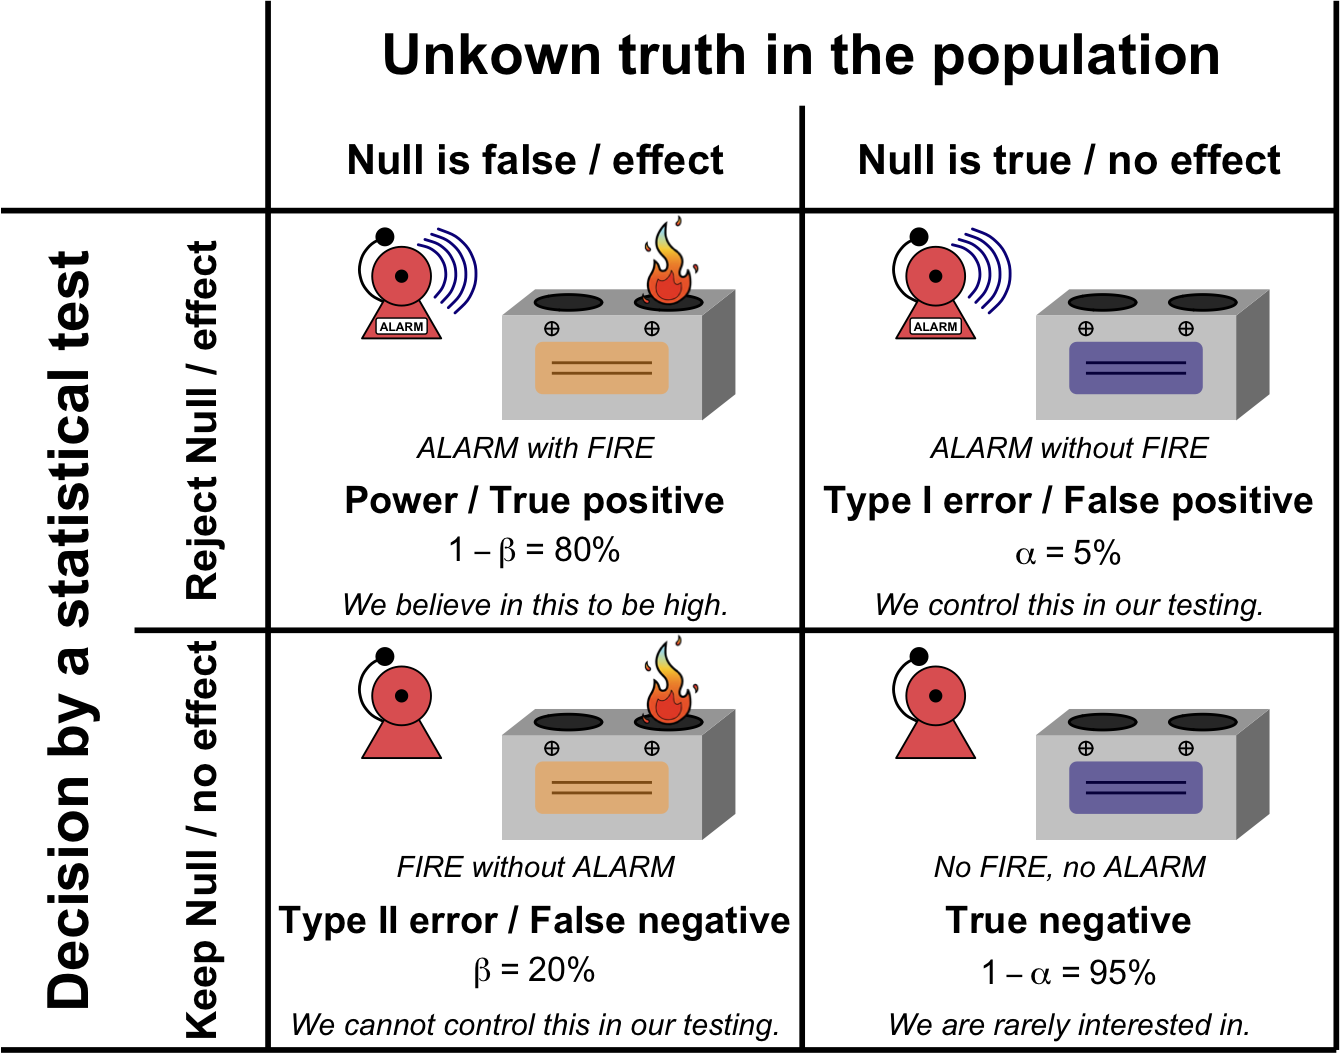
- Type 1 and 2 errors: Before the experiment begins, the following is determined:
- \(\alpha\) (alpha): How often am I allowed to incorrectly find an effect? (e.g. 5%)
- \(\beta\) (Beta): How often am I allowed to mistakenly overlook a real effect? (Power/test strength).
- The result: A tough decision. ‘Accept \(H_0\)’ or ‘Reject \(H_0\)’ (or Accept \(H_A\)).
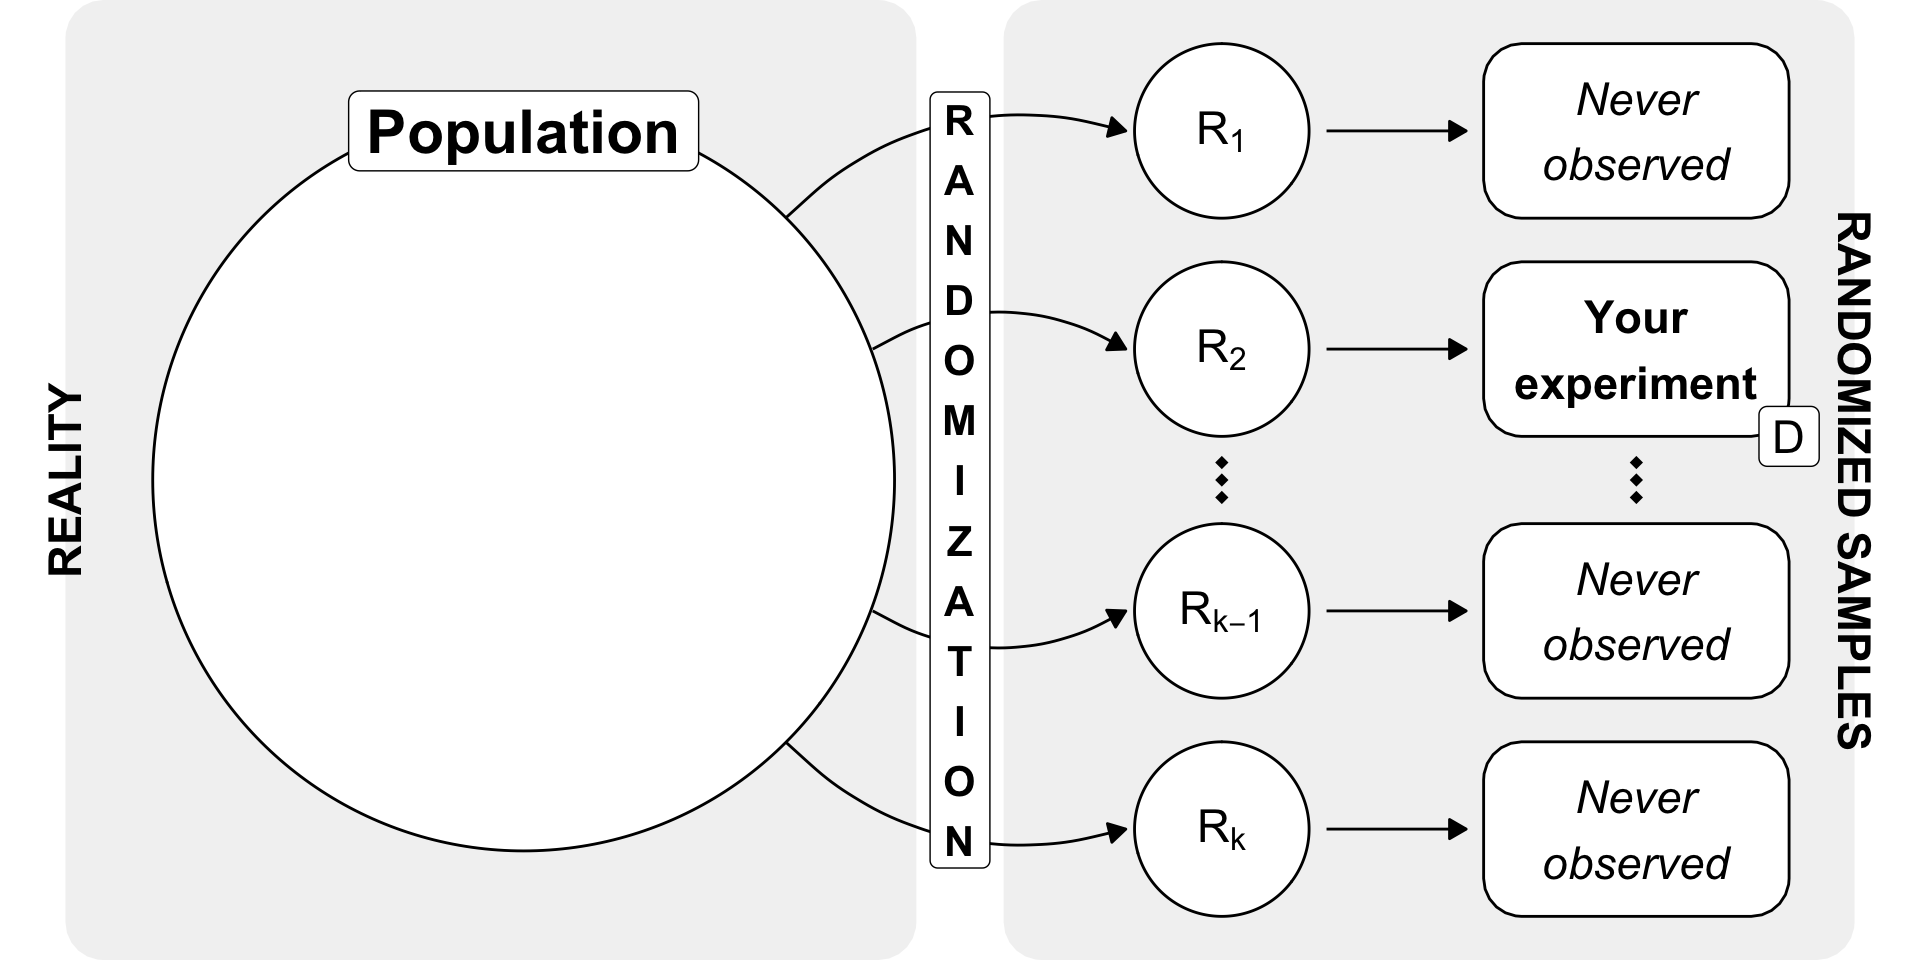
- Goal: Minimisation of losses over many repeated experiments (as in industrial production).
Neymans philosophy: We are not looking for the ‘truth’ in individual cases, but rather we behave in such a way that we are wrong as rarely as possible in 1000 decisions.
8.2.3 Today’s ‘hybrid chaos’
Modern textbooks and software (such as SPSS or R) often use a hybrid that historically makes no sense:
- We define \(\alpha = 5\%\) (Neyman-Pearson).
- We calculate an exact p-value (Fisher).
- We report the p-value as evidence (Fisher), but use it for a hard yes/no decision (Neyman-Pearson).
- We talk about ‘power’ (Neyman-Pearson), but often only test against a non-specific alternative.
This mishmash often leads to misunderstandings, such as that a \(p = 0.001\) indicates a ‘stronger effect’ than \(p = 0.049\) (Fisher thinking), even though in Neyman-Pearson logic at \(\alpha = 5\%\) , one would have to make exactly the same decision in both cases (‘Reject \(H_0\)’).
8.3 R packages used
8.4 Data
8.5 Alternatives
Further tutorials and R packages on XXX
8.6 Glossary
- term
-
what does it mean.
8.7 The meaning of “Models of Reality” in this chapter.
- itemize with max. 5-6 words