Tales of data
Last modified on 09. July 2026 at 11:35:02
“X-Factor, the unfathomable. We live in a world where dreams and reality are closely intertwined, where facts often seem like figments of the imagination that we cannot explain. Can you distinguish between truth and lies? Yours, Jonathan Frakes.” — German intro of Beyond Belief: Fact or Fiction
Once upon a time Cadiergues and his team won the Nobel Prize in Stockholm for their work with dog and cat fleas1. This sparked a time of increased scientific research on fleas of all types of hosts, with scientists studying them in great detail. A wealth of research questions remained to be addressed, while funding opportunities lay in wait. We now have the great opportunity to use open-source data to revisit all the exciting findings in flea research. What are our main research topics and questions that we want to cover?
Unfortunately, none of this ever happened in our branch of reality. But it might happen in countless other branches2.
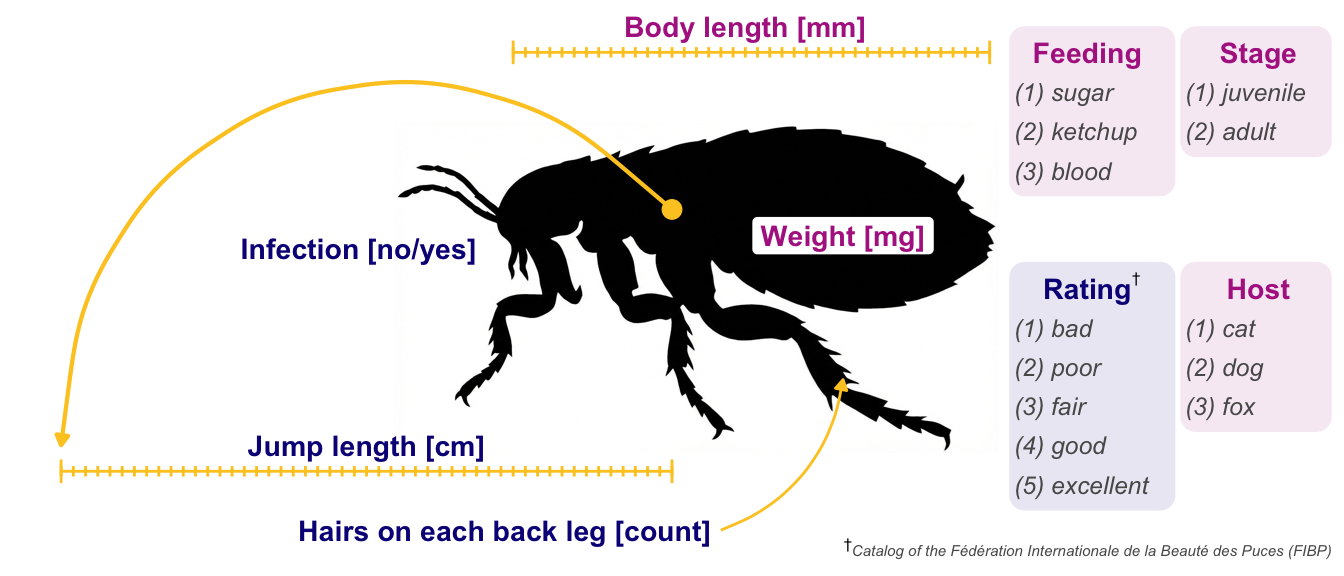
Quality Rating (ACR): 1-Bad, 2-Poor, 3-Fair, 4-Good, 5-Excellent.
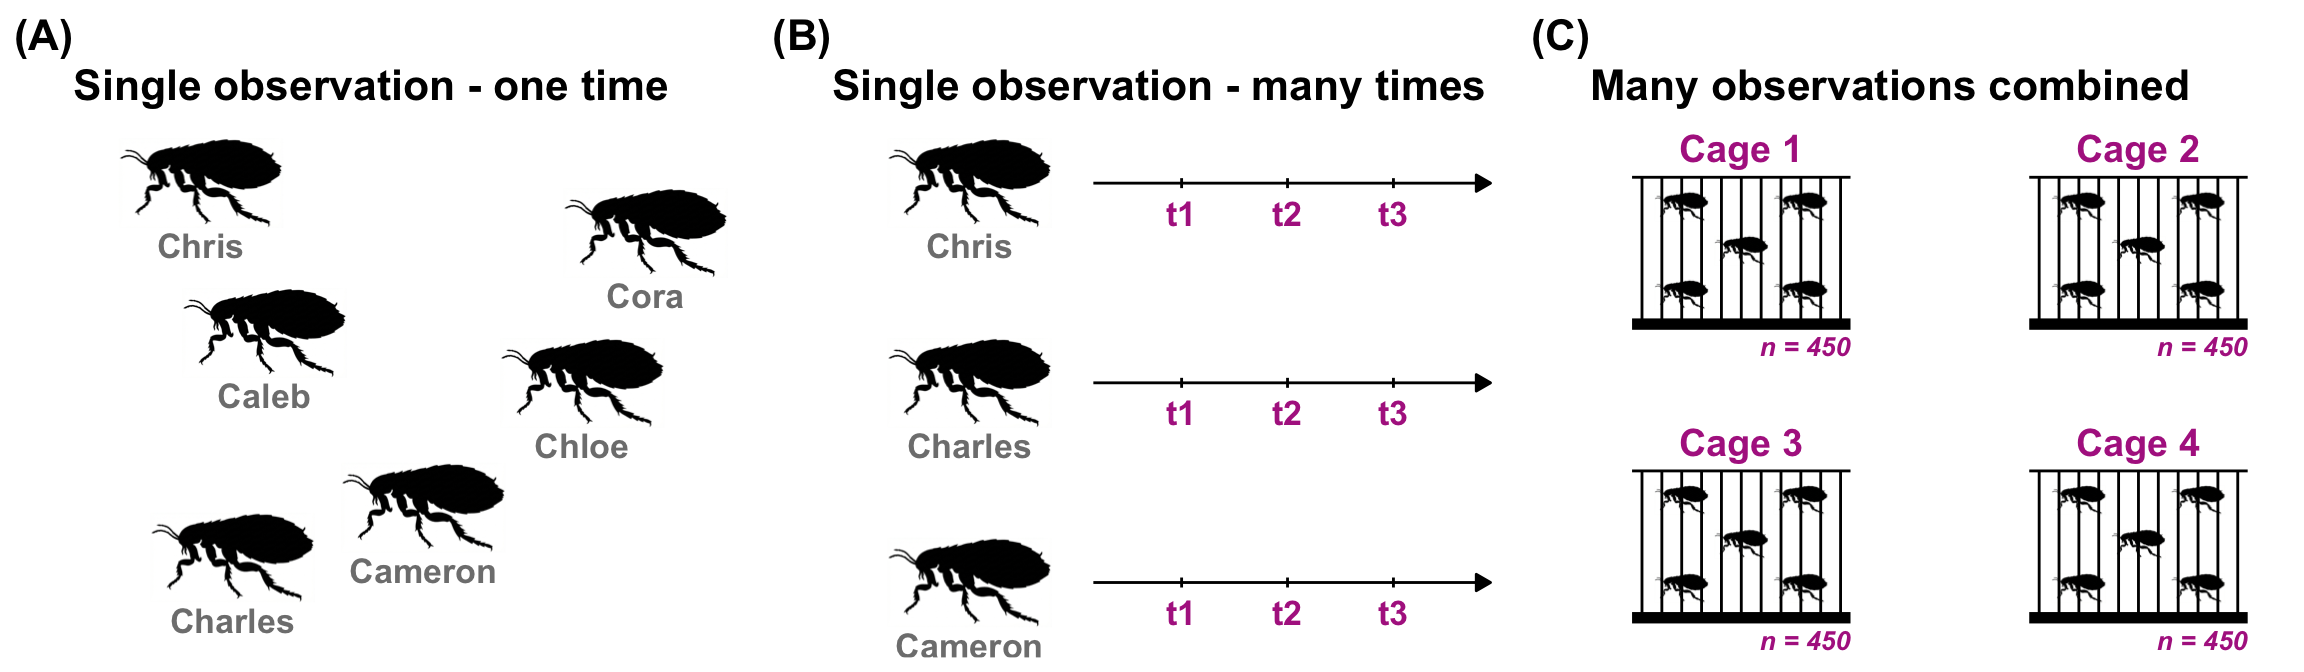
How large is the sample size?
References
[1]
Cadiergues MC, Joubert C, Franc M. A comparison of jump performances of the dog flea, ctenocephalides canis (curtis, 1826) and the cat flea, ctenocephalides felis felis (bouché, 1835). Veterinary parasitology. 2000;92(3):239-241.
[2]
Everett III H. ’Relative state’ formulation of quantum mechanics. Reviews of modern physics. 1957;29(3):454.