```{r echo = FALSE, warning = FALSE, message=FALSE}
source("init.R")
```
# Template chapter {#sec-temp}
*Last modified on `r format(fs::file_info("template-chapter.qmd")$modification_time, '%d. %B %Y at %H:%M:%S')`*
> *"A quote." --- Dan Meyer*
## General background
```{r}
set.seed(20251226) #20251226
cor_high_tbl <- tibble(weight = abs(rnorm(5, 3, 4)),
                       jumplength = 10 + 1 * weight + rnorm(5, 0, 4)) |>
  mutate(sweight = weight - mean(weight),
         sjump = jumplength - mean(jumplength),
         ss_xy = sweight * sjump,
         ss_x = sweight^2,
         ss_y = sjump^2,
         sign_xy = ifelse(sign(ss_xy) == -1, "\U2012", "+"))
set.seed(202511)

sum(cor_high_tbl$ss_x)
sum(cor_high_tbl$ss_x) |> sqrt()
sum(cor_high_tbl$ss_y)
sum(cor_high_tbl$ss_y) |> sqrt()
sum(cor_high_tbl$ss_xy)
```
```{r}
cor(cor_high_tbl$weight, cor_high_tbl$jumplength)
```
```{r}
cov(cor_high_tbl$weight, cor_high_tbl$jumplength)
```
```{r}
lm_fit <- lm(jumplength ~ weight, data = cor_high_tbl)
```
```{r}
vcov(lm_fit)
```
```{r}
#| message: false
#| echo: false
#| warning: false
#| fig-align: center
#| fig-height: 5
#| fig-width: 9
#| fig-cap: "foo"
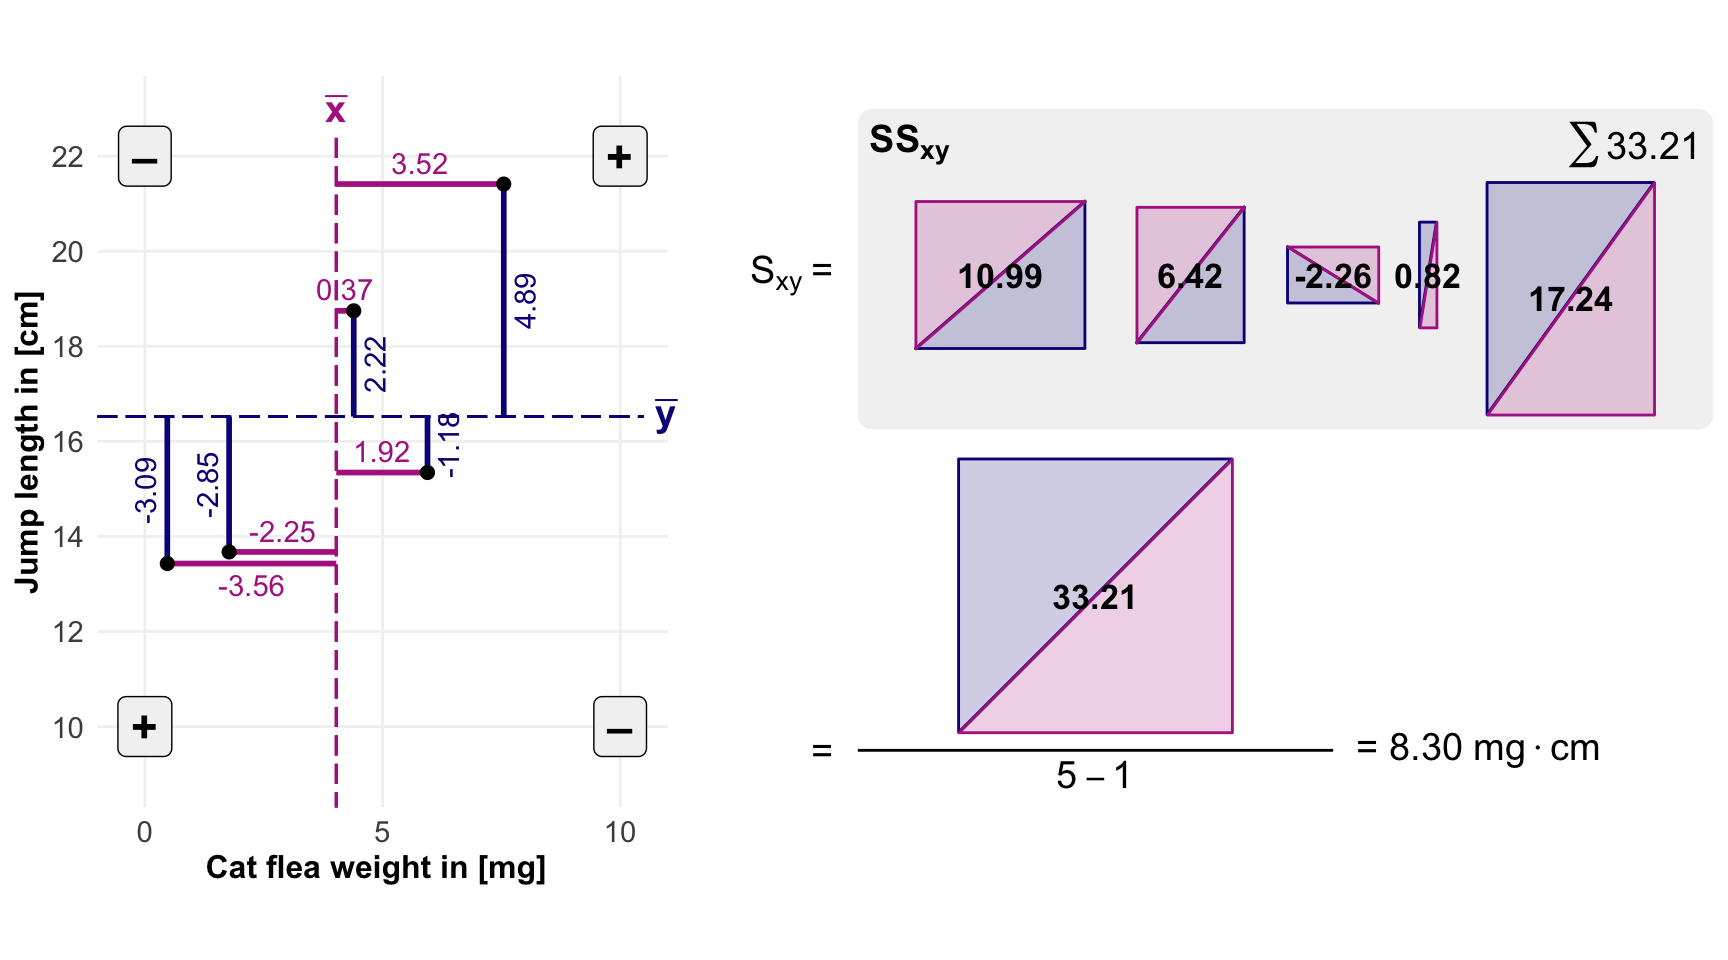
#| label: fig-corr-theo-example
geom_spit_tile <- function(x, y, a, b, weight, color, fill) {
a <- a*weight
b <- b*weight
x <- x - b/2
y <- y - a/2
list(
geom_shape(data = tibble(x = c(x, x+b-0.01, x),
y = c(y+0.01, y+a, y+a)),
aes(x, y), color = color[1], fill = fill[1], alpha = 0.2),
geom_shape(data = tibble(x = c(x+0.01, x+b, x+b),
y = c(y, y, y+a-0.01)),
aes(x, y), color = color[2], fill = fill[2], alpha = 0.2)
)
}
cor_high_tbl |>
ggplot(aes(x = weight, y = jumplength)) +
theme_book() +
coord_equal() +
annotate("segment", x = rep(-1, 7), xend = rep(11, 7),
y = c(10, 12, 14, 16, 18, 20, 22),
yend = c(10, 12, 14, 16, 18, 20, 22),
color = "gray95") +
geom_vline(xintercept = c(0,5,10), color = "gray95") +
geom_segment(x = -1, xend = 10.5,
y = mean(cor_high_tbl$jumplength),
yend = mean(cor_high_tbl$jumplength), color = "#0D0887FF", linetype = 11) +
annotate("text", x = 10.75, y = mean(cor_high_tbl$jumplength),
hjust = "left", label = expression(bold(bar(y))),
size = 5, color = "#0D0887FF") +
geom_segment(aes(x = mean(cor_high_tbl$weight), xend = weight,
y = jumplength, yend = jumplength), color = "#B12A90FF", size = 1) +
geom_segment(x = mean(cor_high_tbl$weight),
xend = mean(cor_high_tbl$weight),
y = 7, yend = 22.5, color = "#B12A90FF", linetype = 11) +
annotate("text", x = mean(cor_high_tbl$weight), y = 23,
hjust = "center", label = expression(bold(bar(x))),
size = 5, color = "#B12A90FF") +
geom_segment(aes(y = mean(cor_high_tbl$jumplength), yend = jumplength,
x = weight, yend = weight), color = "#0D0887FF", size = 1) +
geom_point(size = 2) +
scale_x_continuous(breaks = c(0,5,10), limits = c(NA, 33),
expand = expand_scale(mult = 0)) +
scale_y_continuous(breaks = c(10, 12, 14, 16, 18, 20, 22),
labels = c("10", "12", "14", "16", "18", "20", "22"),
limits = c(9, 23)) +
labs(x = str_pad("Cat flea weight in [mg]", 142.5, "right"), y = "Jump length in [cm]") +
scale_color_viridis(discrete = TRUE, option = "plasma", end = 0.9) +
## upper right
annotate("text", x = 14.5, y = 19.5, hjust = "right", label = expression(S[xy]~"="),
size = 5) +
geom_shape(data = tibble(x = c(15, 33, 33, 15),
y = c(16.25, 16.25, 23, 23)),
aes(x, y), radius = unit(0.2, 'cm'), fill = "gray95") +
annotate("text", x = 32.75, y = 22.25, label = expression(sum()*33.21), size = 5,
hjust = "right") +
annotate("text", x = 15.25, y = 22.25, label = expression(bold(SS[xy])), size = 5,
hjust = "left") +
geom_spit_tile(x = c(18), y = c(19.5),
b = cor_high_tbl$sweight[1], a = cor_high_tbl$sjump[1], weight = 1,
color = c("#0D0887FF", "#B12A90FF"), fill = c("#0D088780", "#B12A9080")) +
geom_spit_tile(x = c(22), y = c(19.5),
b = cor_high_tbl$sweight[2], a = cor_high_tbl$sjump[2], weight = 1,
color = c("#0D0887FF", "#B12A90FF"), fill = c("#0D088780", "#B12A9080")) +
geom_spit_tile(x = c(25), y = c(19.5),
b = cor_high_tbl$sweight[3], a = cor_high_tbl$sjump[3], weight = 1,
color = c("#0D0887FF", "#B12A90FF"), fill = c("#0D088780", "#B12A9080")) +
geom_spit_tile(x = c(27), y = c(19.5),
b = cor_high_tbl$sweight[4], a = cor_high_tbl$sjump[4], weight = 1,
color = c("#0D0887FF", "#B12A90FF"), fill = c("#0D088780", "#B12A9080")) +
geom_spit_tile(x = c(30), y = c(19),
b = cor_high_tbl$sweight[5], a = cor_high_tbl$sjump[5], weight = 1,
color = c("#0D0887FF", "#B12A90FF"), fill = c("#0D088780", "#B12A9080")) +
annotate("text", x = c(18, 22, 25, 27, 30), y = c(19.5, 19.5, 19.5, 19.5, 19),
label = round(cor_high_tbl$ss_xy, 2), fontface = 2, size = 4.5) +
annotate("text", x = 30, y = 23.25, label = expression(sum()*33.21), size = 4.5,
hjust = "right") +
# annotate("text", x = 14.25, y = 23.25, label = expression(bold(SS[xy])), size = 4.5,
# hjust = "left") +
annotate("label", x = c(0, 0, 10, 10), y = c(10, 22, 10, 22),
label = c("+", "\U2012", "\U2012", "+"), size = 6, fontface = 2,
fill = "gray95") +
geom_spit_tile(x = c(20), y = c(12.75),
b = 5.76, a = 5.76, weight = 1,
color = c("#0D0887FF", "#B12A90FF"), fill = c("#0D088780", "#B12A9080")) +
annotate("text", x = 14.5, y = 9.5, hjust = "right", label = expression("="),
size = 5) +
annotate("text", x = 20, y = 12.75, label = "33.21", fontface = 2, size = 4.5) +
annotate("segment", x = 15, xend = 25, y = 9.5, yend = 9.5) +
annotate("text", x = 20, y = 9, label = expression(5-1), size = 5) +
annotate("text", x = 25.5, y = 9.5, hjust = "left", label = expression("= 8.30 mg"%.%"cm"),
size = 5) +
annotate("text", x = mean(cor_high_tbl$weight) + cor_high_tbl$sweight/2,
y = cor_high_tbl$jumplength + c(-0.45, 0.45, 0.45, 0.45, 0.45),
label = round(cor_high_tbl$sweight, 2), color = "#B12A90FF") +
annotate("text", x = cor_high_tbl$weight + c(-0.45, -0.45, 0.45, 0.45, 0.45),
y = mean(cor_high_tbl$jumplength) + cor_high_tbl$sjump/2, angle = 90,
label = round(cor_high_tbl$sjump, 2), color = "#0D0887FF") +
theme(panel.grid = element_blank())
```
```{r}
#| message: false
#| echo: false
#| warning: false
#| fig-align: center
#| fig-height: 3.5
#| fig-width: 7
#| fig-cap: "foo"
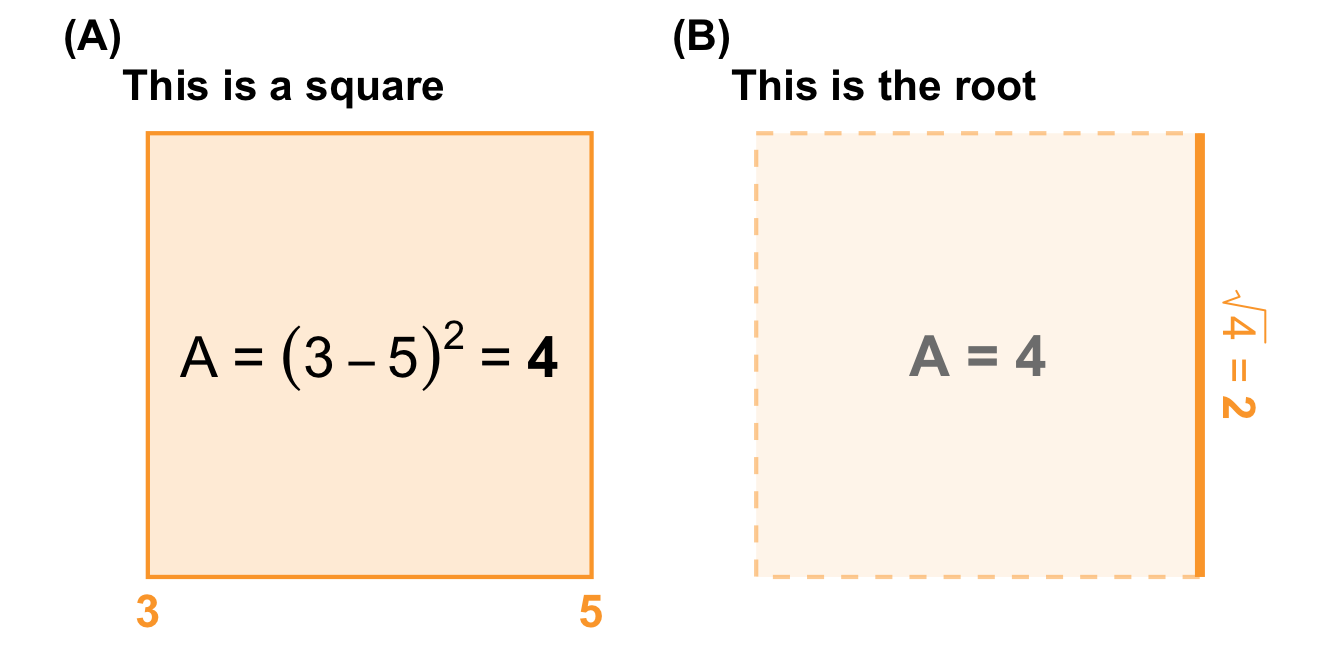
#| label: fig-square-and-root
p1_square <- ggplot() +
theme_void() +
## theme_minimal() +
coord_equal() +
scale_x_continuous(breaks = seq(-5, 5, 1), limits = c(-1, 1.25)) +
scale_y_continuous(breaks = seq(-5, 5, 1), limits = c(-1.25, 1)) +
geom_tile(aes(x = 0, y = 0, width = 2, height = 2),
fill = "#FCA63680", color = "#FCA636FF", alpha = 0.2, linewidth = 0.75) +
# annotate("text", x = 0, y = 0, label = expression((a-b)^2), size = 7.5, color = "black") +
annotate("text", x = 0, y = 0, label = expression(A~"="~(3-5)^2~"="~bold("4")),
size = 7.5, color = "black") +
# annotate("text", x = 0, y = -1.15, label = expression(a-b), size = 6, color = "gray50") +
# annotate("text", x = 1.15, y = 0, label = expression(a-b), size = 6, color = "gray50",
# angle = -90) +
annotate("text", x = c(-1, 1), y = -1.15, label = c(3, 5), color = "#FCA636FF",
size = 6, fontface = 2) +
labs(title = "This is a square") +
theme(plot.title = element_text(size = 16, face = "bold"),
plot.subtitle = element_text(size = 12, face = "italic"))
p2_square_root <- ggplot() +
theme_void() +
##theme_minimal() +
coord_equal() +
scale_x_continuous(breaks = seq(-5, 5, 1), limits = c(-1, 1.25)) +
scale_y_continuous(breaks = seq(-5, 5, 1), limits = c(-1.25, 1)) +
geom_tile(aes(x = 0, y = 0, width = 2, height = 2), linetype = 2,
fill = "#FCA63680", color = "#FCA63680", alpha = 0.1, linewidth = 0.75) +
annotate("segment", x = 1, y = -1, xend = 1, yend = 1, linewidth = 1.75, color = "#FCA636FF") +
#annotate("text", x = 1.2, y = 0, label = expression(sqrt((a-b)^2)), size = 6, color = "#FCA636FF",
# angle = -90) +
annotate("text", x = 0, y = 0, label = "A = 4", fontface = 2,
size = 7.5, color = "gray50") +
annotate("text", x = 1.2, y = 0, label = expression(sqrt(4)~"="~bold("2")), size = 6,
color = "#FCA636FF", angle = -90) +
labs(title = "This is the root") +
theme(plot.title = element_text(size = 16, face = "bold"),
plot.subtitle = element_text(size = 12, face = "italic"))
p1_square + p2_square_root +
plot_layout(ncol = 2) +
plot_annotation(tag_levels = 'A', tag_prefix = '(', tag_suffix = ')') &
theme(plot.tag = element_text(size = 16, face = "bold"))
```
```{r}
#| message: false
#| echo: false
#| warning: false
#| fig-align: center
#| fig-height: 3.5
#| fig-width: 7
#| fig-cap: "foo"
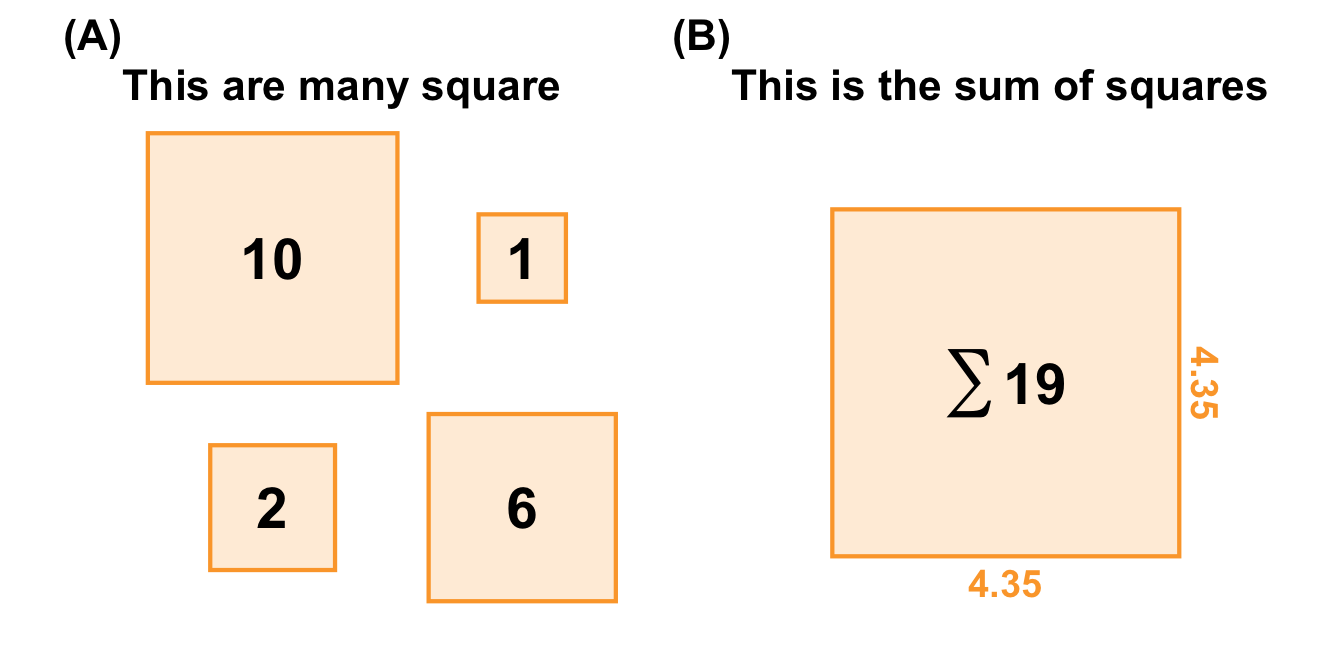
#| label: fig-square-sum
p1_square_many <- ggplot() +
theme_void() +
## theme_minimal() +
coord_equal() +
scale_x_continuous(breaks = seq(-5, 5, 1), limits = c(-1, 1)) +
scale_y_continuous(breaks = seq(-5, 5, 1), limits = c(-1, 1)) +
geom_tile(aes(x = c(-0.5, -0.5, 0.5, 0.5), y = c(-0.5, 0.5, -0.5, 0.5),
width = c(0.5, 1, 0.75, 0.35),
height = c(0.5, 1, 0.75, 0.35)), linetype = 1,
fill = "#FCA63680", color = "#FCA636FF", alpha = 0.2, linewidth = 0.75) +
annotate("text", x = c(-0.5, -0.5, 0.5, 0.5), y = c(-0.5, 0.5, -0.5, 0.5),
label = round(c(0.5, 1, 0.75, 0.35)^2, 1)*10, size = 7.5, color = "black",
fontface = 2) +
labs(title = "This are many square") +
theme(plot.title = element_text(size = 16, face = "bold"),
plot.subtitle = element_text(size = 12, face = "italic"))
p2_square_sum <- ggplot() +
theme_void() +
##theme_minimal() +
coord_equal() +
scale_x_continuous(breaks = seq(-5, 5, 1), limits = c(-1, 1)) +
scale_y_continuous(breaks = seq(-5, 5, 1), limits = c(-1, 1)) +
geom_tile(aes(x = 0, y = 0, width = 1.39, height = 1.39),
fill = "#FCA63680", color = "#FCA636FF", alpha = 0.2, linewidth = 0.75) +
annotate("text", x = 0, y = 0, size = 7.5, color = "black", label = expression(sum()*bold("19")),
fontface = 2) +
annotate("text", x = 0, y = -0.8, label = 4.35, size = 5, color = "#FCA636FF", fontface = 2) +
annotate("text", x = 0.8, y = 0, label = 4.35, size = 5, color = "#FCA636FF", fontface = 2,
angle = -90) +
labs(title = "This is the sum of squares") +
theme(plot.title = element_text(size = 16, face = "bold"),
plot.subtitle = element_text(size = 12, face = "italic"))
p1_square_many + p2_square_sum +
plot_layout(ncol = 2) +
plot_annotation(tag_levels = 'A', tag_prefix = '(', tag_suffix = ')') &
theme(plot.tag = element_text(size = 16, face = "bold"))
```
```{r}
#| message: false
#| echo: false
#| warning: false
#| fig-align: center
#| fig-height: 2.25
#| fig-width: 7
#| fig-cap: "foo"
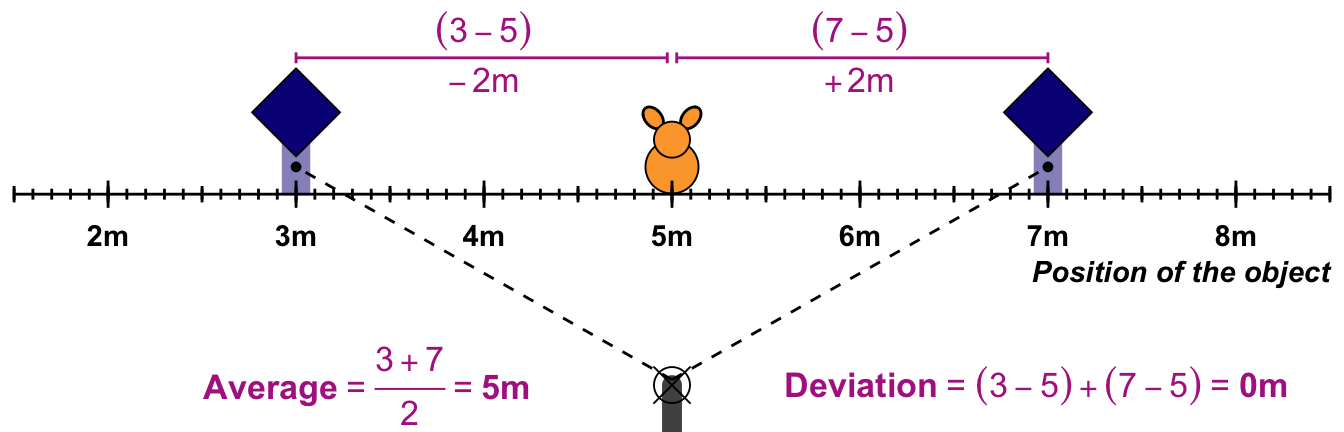
#| label: fig-rabbit-shot
ggplot() +
theme_void() +
##theme_minimal() +
coord_cartesian(xlim = c(0.75, 7.25), ylim = c(-4, 3.2)) +
scale_x_continuous(breaks = seq(-10, 10, 1)) +
annotate("segment", x = c(2, 6), xend = c(2, 6), y = 0, yend = 1.25, size = 5,
color = "#0D088780") +
annotate("point", x = c(2, 6), y = 1.5, shape = 23, size = 12, fill = "#0D0887FF") +
annotate("point", x = 4, y = 0.5, shape = 21, size = 9, fill = "#FCA636FF") +
geom_ellipse(aes(x0 = 4.1, y0 = 1.4, a = 0.2, b = 0.05, angle = pi/2.15), fill = "#FCA636FF") +
geom_ellipse(aes(x0 = 3.9, y0 = 1.4, a = 0.2, b = 0.05, angle = -pi/2.15), fill = "#FCA636FF") +
annotate("point", x = 4, y = 1, shape = 21, size = 6, fill = "#FCA636FF") +
scale_y_continuous(breaks = seq(-5, 5, 1)) +
annotate("segment", x = 0.5, xend = 7.5, y = 0, yend = 0) +
annotate("segment", x = 1:7, xend = 1:7, y = -0.25, yend = 0.25) +
annotate("segment", x = seq(0.5, 7.5, 0.1), xend = seq(0.5, 7.5, 0.1),
y = -0.1, yend = 0.1) +
annotate("segment", x = seq(0.5, 7.5, 0.5), xend = seq(0.5, 7.5, 0.5),
y = -0.15, yend = 0.15) +
annotate("text", x = 1:7, y = -0.75, label = str_c(2:8, "m", sep = ""), fontface = 2) +
annotate("point", x = 4, y = -3.5, shape = 13, size = 6) +
annotate("segment", x = 4, xend = 4, y = -4.5, yend = -3.5, linetype = 1, size = 3.5,
lineend = "round", alpha = 0.75) +
annotate("segment", x = 4, xend = 6, y = -3.4, yend = 0.5, linetype = 2) +
annotate("segment", x = 4, xend = 2, y = -3.4, yend = 0.5, linetype = 2) +
annotate("point", x = c(2,6), y = 0.5, shape = 20, size = 2) +
annotate("segment", x = 2, xend = 3.975, y = 2.5, yend = 2.5, linetype = 1, color = "#B12A90FF") +
annotate("segment", x = 4.025, xend = 6, y = 2.5, yend = 2.5, linetype = 1, color = "#B12A90FF") +
annotate("segment", x = c(2, 3.975, 4.025, 6), xend = c(2, 3.975, 4.025, 6),
y = 2.4, yend = 2.6, linetype = 1, color = "#B12A90FF") +
annotate("text", x = 3, y = 3, label = expression((3-5)), color = "#B12A90FF", size = 4.5) +
annotate("text", x = 3, y = 2.1, label = expression(-2*"m"), color = "#B12A90FF", size = 4.5) +
annotate("text", x = 5, y = 3, label = expression((7-5)), color = "#B12A90FF", size = 4.5) +
annotate("text", x = 5, y = 2.1, label = expression(+2*"m"), color = "#B12A90FF", size = 4.5) +
annotate("text", x = 4.6, y = -3.5,
label = expression(bold(Deviation)~"="~(3-5)+(7-5)~"="~bold("0m")),
color = "#B12A90FF", size = 4.5, hjust = "left") +
annotate("text", x = 3.25, y = -3.5,
label = expression(bold(Average)~"="~frac(3+7,2)~"="~bold("5m")),
color = "#B12A90FF", size = 4.5, hjust = "right") +
annotate("text", x = 7.5, y = -1.4, label = "Position of the object", fontface = 4, hjust = "right")
```
## Theoretical background
## R packages used
## Data
## Alternatives
Further tutorials and R packages on XXX
## Glossary
term
: what does it mean.
## The meaning of "Models of Reality" in this chapter.
- itemize with max. 5-6 words
## Summary
## References {.unnumbered}